
DCAing is a simple method for DIY investors to invest for the long-term. Investing for your long-term is important. Everyone over 18 and in the workforce should have a tax free savings account and make use of it, even if you can only put in $50 bucks a month to begin. Older you will be glad you did.
Dollar Cost Averaging
“Dollar-cost averaging is the practice of systematically investing equal amounts of money at regular intervals, regardless of the price of a security.”
This investing strategy can reduce the impact of price volatility. More info at Investopedia.
How to DCA Better
Instead of just buying on the first of the month try to do it with a little extra patience and knowledge about technical analysis..
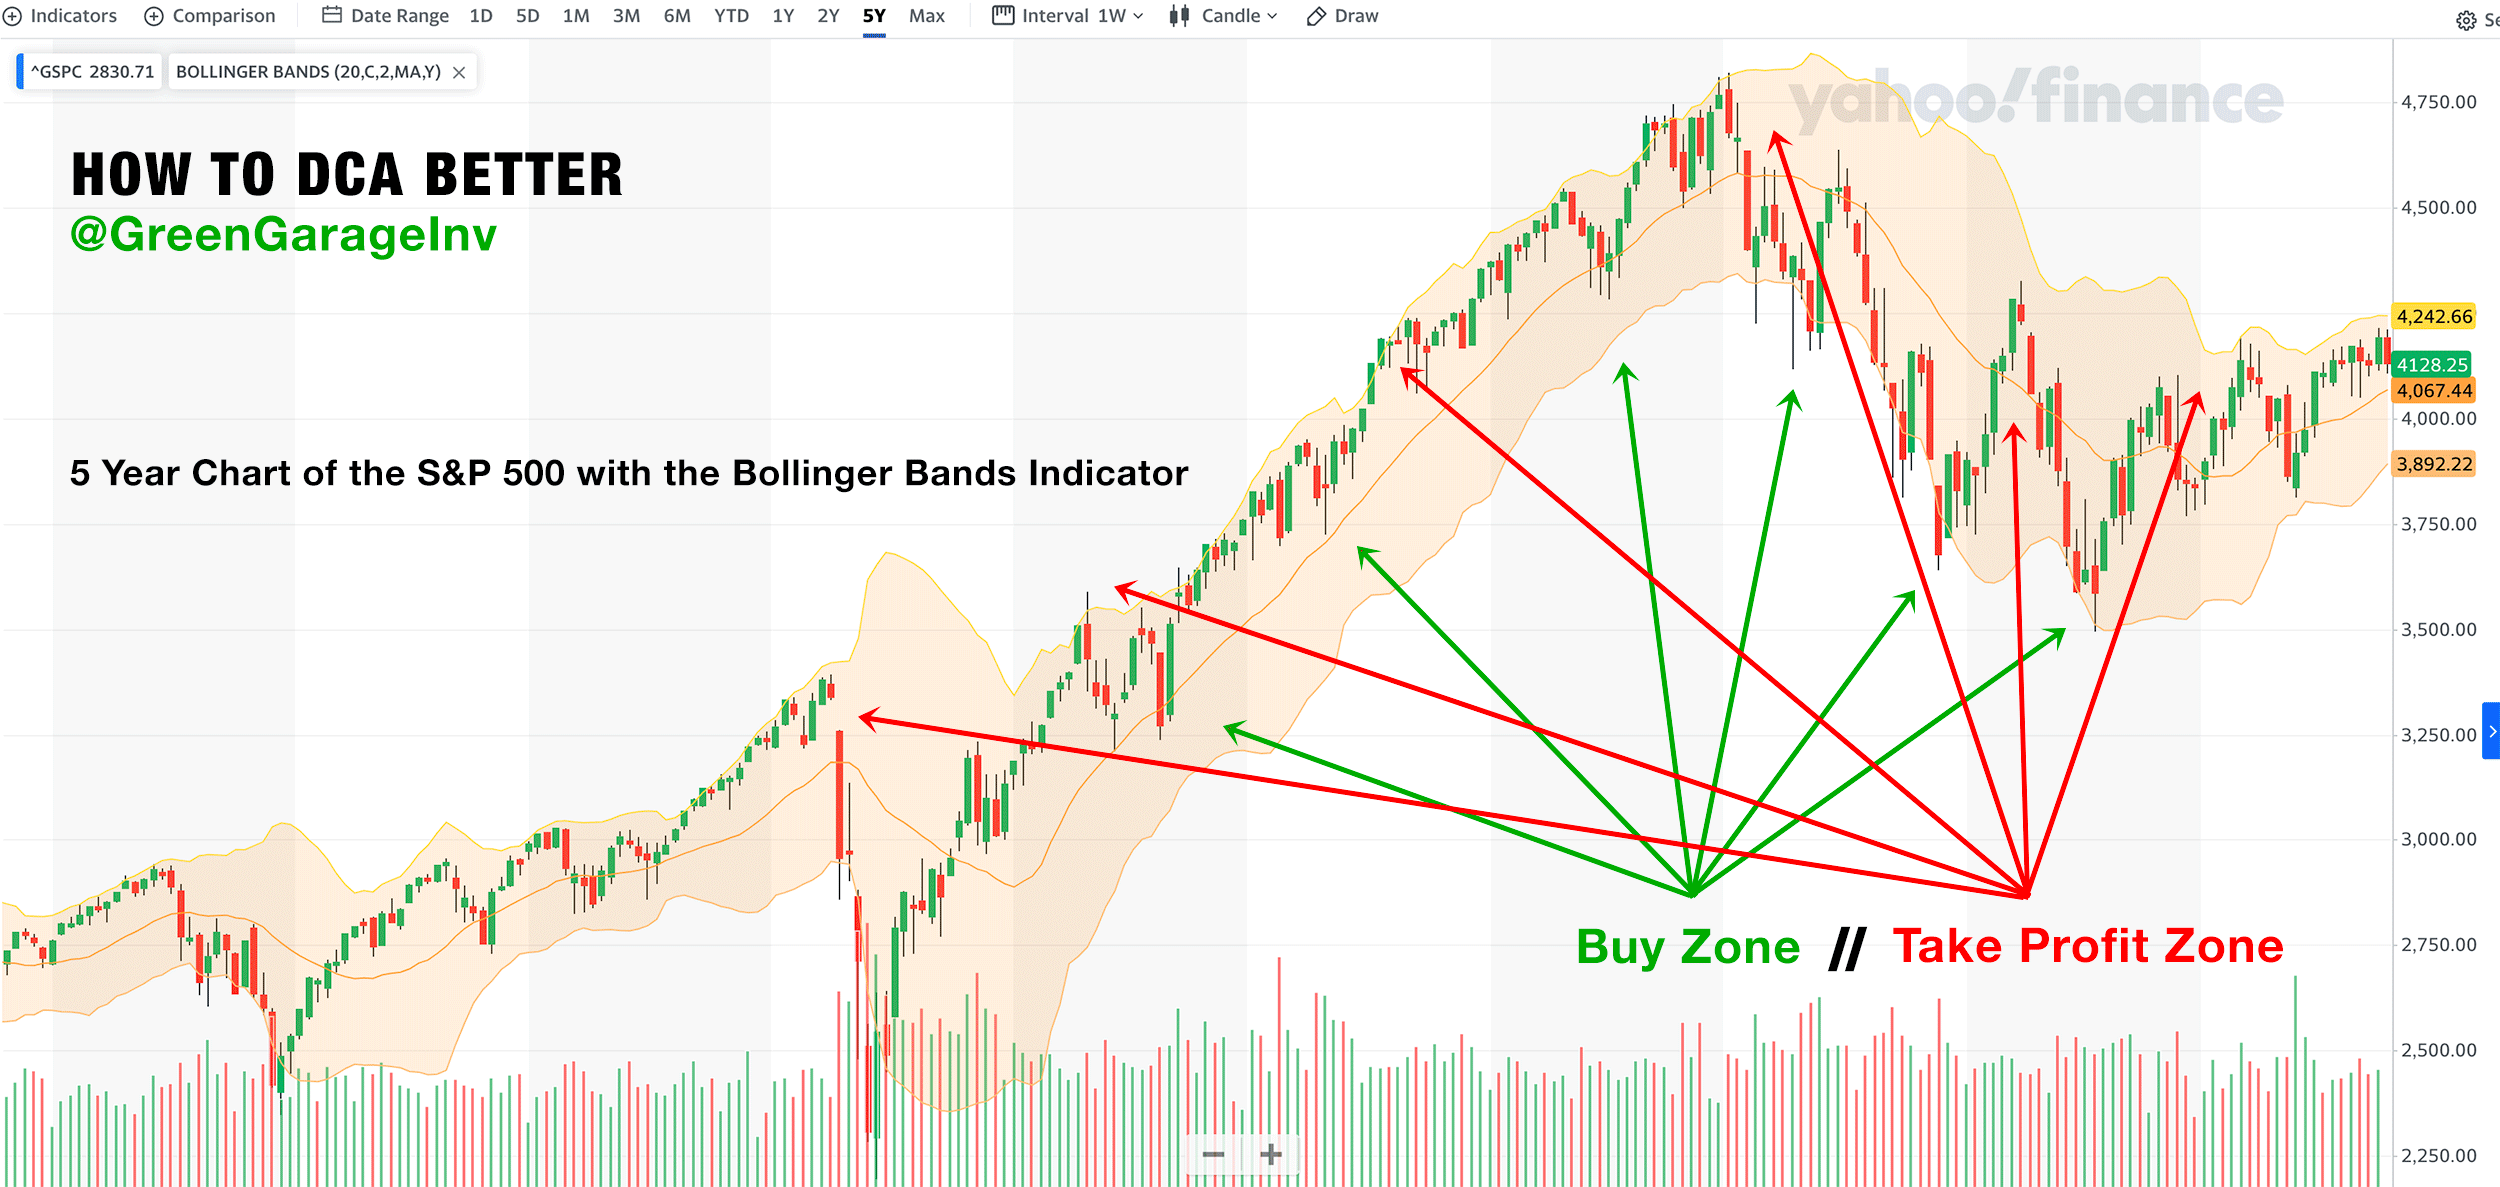
Take a look at the chart of the stock you are interested in. Charts are free on Yahoo Finance, Trading View, etc. Apply Bollinger Bands to the chart.
Bollinger Bands are an indicator; each charting tool has it’s own way of adding indicators, but it’s usually a couple button clicks and no drawing required. You can see what the bands look like in the charts included here; the shaded orange part.
- “Bollinger Bands® is a technical analysis tool to generate oversold or overbought signals and was developed by John Bollinger.
- Three lines compose Bollinger Bands: A simple moving average, or the middle band, and an upper and lower band.
- The upper and lower bands are typically 2 standard deviations +/- from a 20-day simple moving average and can be modified.”
More info at Investopedia.
How to Use Bollinger Bands
If your stock is at the top of the band, wait to until it cycles towards the bottom to purchase.
Every stock cycles from the top of the band to the bottom and back up and down regardless of the overall trend of the stock. DCA when the price is closer to the bottom than the top.
If your stock is at the top of the band and there have been several cycles where the trend is up, then even as a long term investor you may want to take profits.
Beyond Bollinger Bands
If you want to get more advanced with charting, try drawing a Fibonacci Retracement. Try drawing it on a five year time frame, a one year time frame and a one month time frame. Draw by selecting the tool, clicking near the highest price in the chart and again near the lowest price (or vice versa). It’s amazing how the Fibonacci lines often align with levels of support and resistance for the stock price. If the price appears to be heading to the next support line down, wait to DCA at that level.
More info about the Fibonacci sequence.
Green Garage Investing
Our system involves a Margin of Safety (buying stocks on sale), with the purpose of long term holding to maximize our CAGR (compounded annual growth rate). This reduces the downside risk and maximizes the upside reward potential. It also enables one to sleep better as your investments spend more time in the green and the more the market dips, the bigger the buying opportunity. This is one of the primary ways retail investors are able to outperform the market.
Our Strike Price List contains up to 300 stocks in all 11 sectors of the market (plus index trackers), and the price we would be willing to pay. Growth with a value investing mindset.
We want retail investors who are busy with their careers, families, etc to benefit from our research. The Strike Price List is priced at only CA$5 to make it accessible for all. More info about Green Garage Investing: https://linktr.ee/greengarageinvesting
")


