")
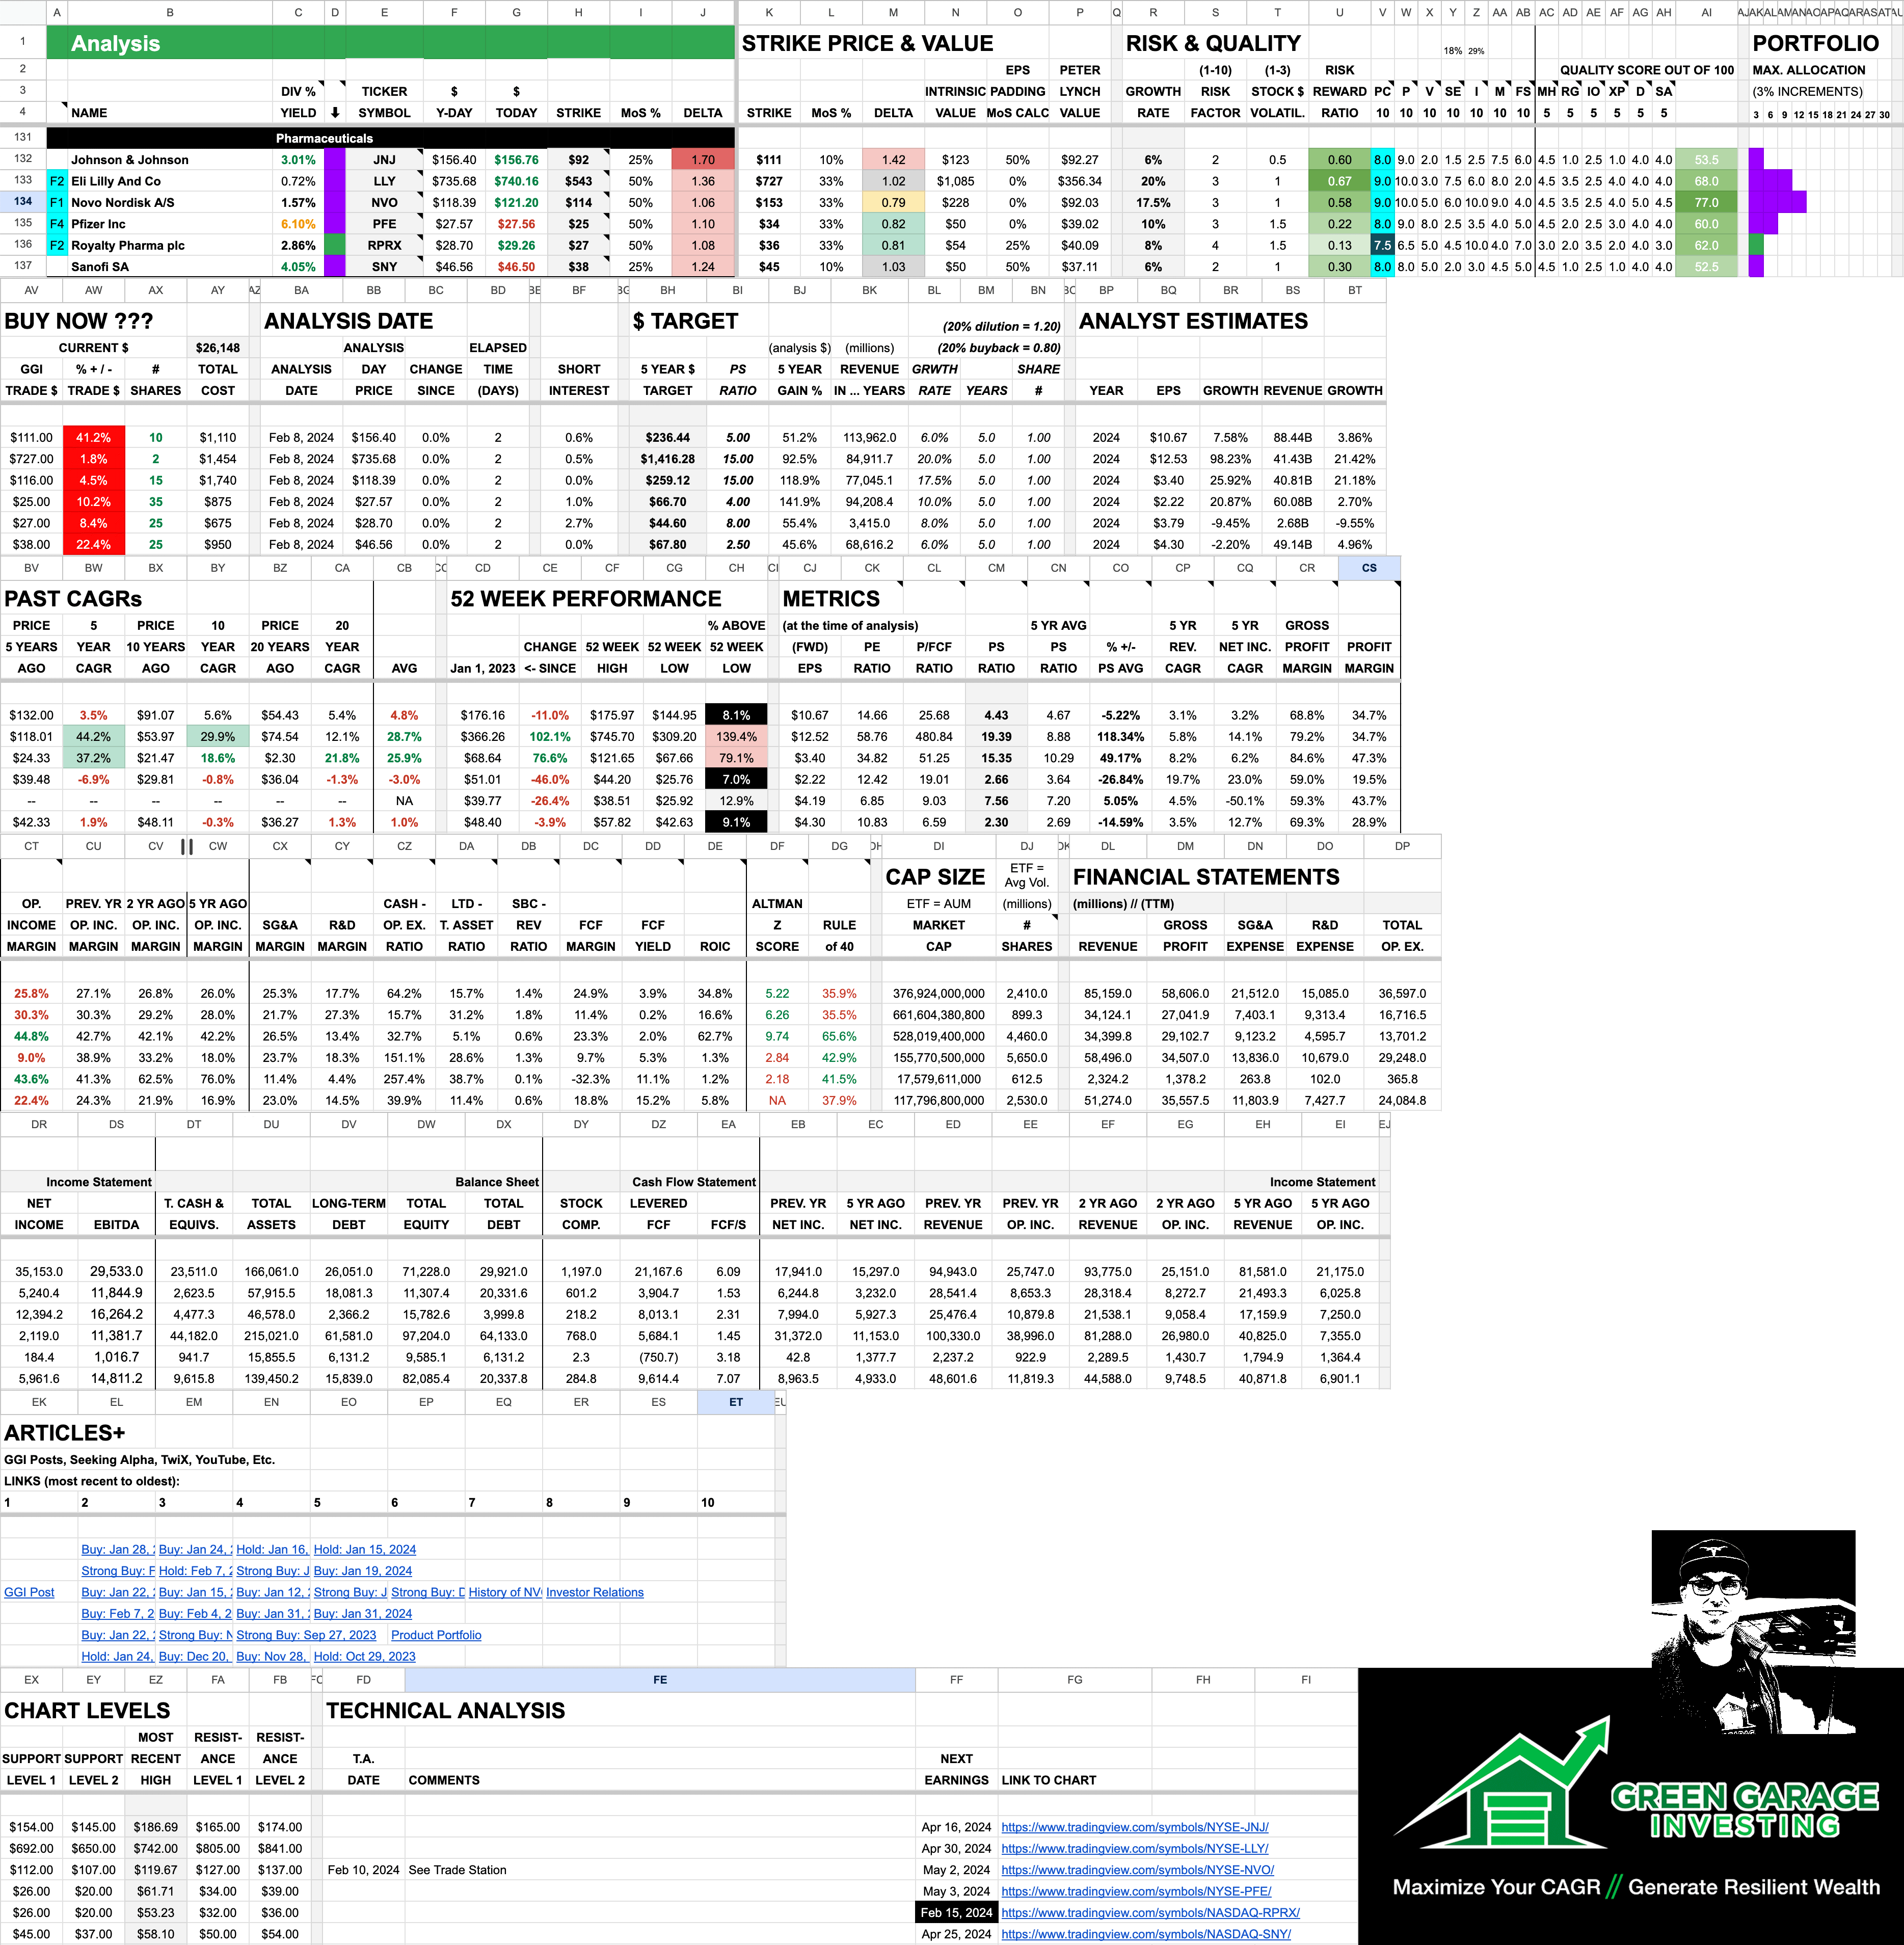
Strike Price = US$114 at 50% MoS (margin of safety) or $153 at 33%
Trade Entry Price = $116 (subject to change at a whim due to market vicissitudes)
Stock Price at publication: $121.20
NOTE: The strike price calculation does not include a 25% padding of the EPS (fwd) to compensate for R&D etc being part of OpEx and not CapEx where it would be depreciable. In comparison, $JNJ needed a 50% padding in order to get even a reasonable strike price (only 42% below current price), with a mere 10% MoS. It may be stock royalty in consumer staples and defensive investing but it’s valuation makes it un-investable, IMO.
// STORY
By now you have probably heard of the GLP (glucagon-like peptide) class of drugs for improving blood sugar levels and thus diabetes and now weight-loss. There are several manufacturers and brands but $NVO make Ozempic for diabetes and Wegovy for weight-loss. GLPs suppress cravings so one consumes less calories. So far the main side effect appears to be loss of lean muscle but one can counteract that with protein and weight training.
There appears to be a long runway for this class of drugs with many iterations to come. This could be a secular tailwind with macro-societal implications.
Morgan Stanley says that global obesity sales in 2030 could reach $54B, up from the current $2.4B:
The landmark study SELECT will demonstrate a 27% decline in the risk of heart attacks, strokes, and cardiovascular deaths for the GLP-1 receptor agonist, the analysts wrote, calling the event “a key factor to improve obesity market access.”
Consult your doctor before taking and all that jazz. And don’t take Ozempic for weight-loss, save that for diabetics.
Here is the company profile for $NVO:
Novo Nordisk A/S, together with its subsidiaries, engages in the research and development, manufacture, and distribution of pharmaceutical products in Europe, the Middle East, Africa, Mainland China, Hong Kong, Taiwan, North America, and internationally. It operates in two segments, Diabetes and Obesity Care, and Rare Disease. The Diabetes and Obesity care segment provides products for diabetes, obesity, cardiovascular, and other emerging therapy areas. The Rare Disease segment offers products in the areas of rare blood disorders, rare endocrine disorders, and hormone replacement therapy. The company also provides insulin pens, growth hormone pens, and injection needles. In addition, it offers smart solutions for diabetes treatment, such as smart insulin pens and Dose Check, an insulin dose guidance application. The company has a collaboration agreement with Aspen Pharmaceuticals to produce insulin products. Novo Nordisk A/S was founded in 1923 and is headquartered in Bagsvaerd, Denmark.
If you’re interested in the history of the company I highly recommend this Acquired Podcast episode: https://www.acquired.fm/episodes/novo-nordisk-ozempic
More company info at Novo’s Investor Relations and their home page.
I’m not going to do a long report on Novo. You can read investing articles at Seeking Alpha (where the past 7 of the past 9 articles are rated Buy or Strong Buy) etc, or find lots of YouTube videos and news articles about them if you’re interested in further researching the company.
$NVO are firing on all cylinders despite being a hundred year old entity. I will let their numbers speak for them as the company has impressive numbers.
// METRICS
Overall Growth Rates:
The past 5 years the stock has a 37.2% CAGR. Over 20 years it’s 21.8%. After crunching the past financial numbers, looking at future expectations and assessing valuations, I give them a 17.5% average growth rate over the next 5 years.
Revenue:
Over the previous 5 years revenue grew at a 8.2% CAGR. In 2024 it is expected to grow 21.2%. Its revenue (ttm) is $34.4B. For comparison, Eli Lilly, a GLP competitor, grew revenue the past 5 years at 5.8% and the stock price CAGR is 44.2%. $LLY stock is currently trading at a richer valuation compared to strike price than $NVO.
Net Income & EPS:
Over the previous 5 years net income grew at a 6.2% CAGR. In 2024 it is expected to grow at 25.9%. Its EPS (fwd) is $3.40.
FCF & ROIC:
The FCF margin is 23.3% and the actual FCF/s (ttm) is $2.31 so they have a P/FCF ratio of 51.3. For comparison, $LLY have a P/FCF of 480.8. Perhaps one could argue that $NVOs P/FCF ratio is a tad high for their growth rate but one could also pad the free cash flow 25% like I sometimes do with the EPS.
The ROIC of $NVO is a smashing 62.7%. That’s some return on invested capital! $LLY is 34.8%, $MSFT 25.3%, $NVDA 42.6% and $TSLA 21%.
Margins:
The $NVO gross profit margin (ttm) is 84.6%. The operating income margin (ttm) is 44.8%. 2 years ago it was 42.1% and 5 years ago 42.2%. Bluechip solid margins and improving. $LLY has a gross profit and OpInc margin of 79.2% and 30.3%.
R&D margin is 13.4% versus 17.7% for $LLY.
Cash & Debt:
$NVO have a cash to operating expense ratio of only 32.7%. This is basically the one thing the CFO could improve upon.
Long term debt to total asset ratio is only 5.1%.
PS Ratio:
$NVO have a price to sales ratio (ttm) of 15.4. The sector average is 3.9. Their 5 year average is 10.3 That puts them 49.2% above their average. Optimally I would want to buy their stock 25% below the average, but unless the market gets very grumpy and reprices everything I expect their average multiple to increase as investors are digging the quality of their revenue.
$LLY have a PS ratio of 19.4 and a 5 year average of 8.9. I actually gave $LLY at slightly higher future growth rate than $NVO but it is much higher than their history would dictate. $LLY have a more diverse portfolio of pharmaceutical products, a higher dividend and possibly a bias from American investors and thus the higher valuation.
// CHART 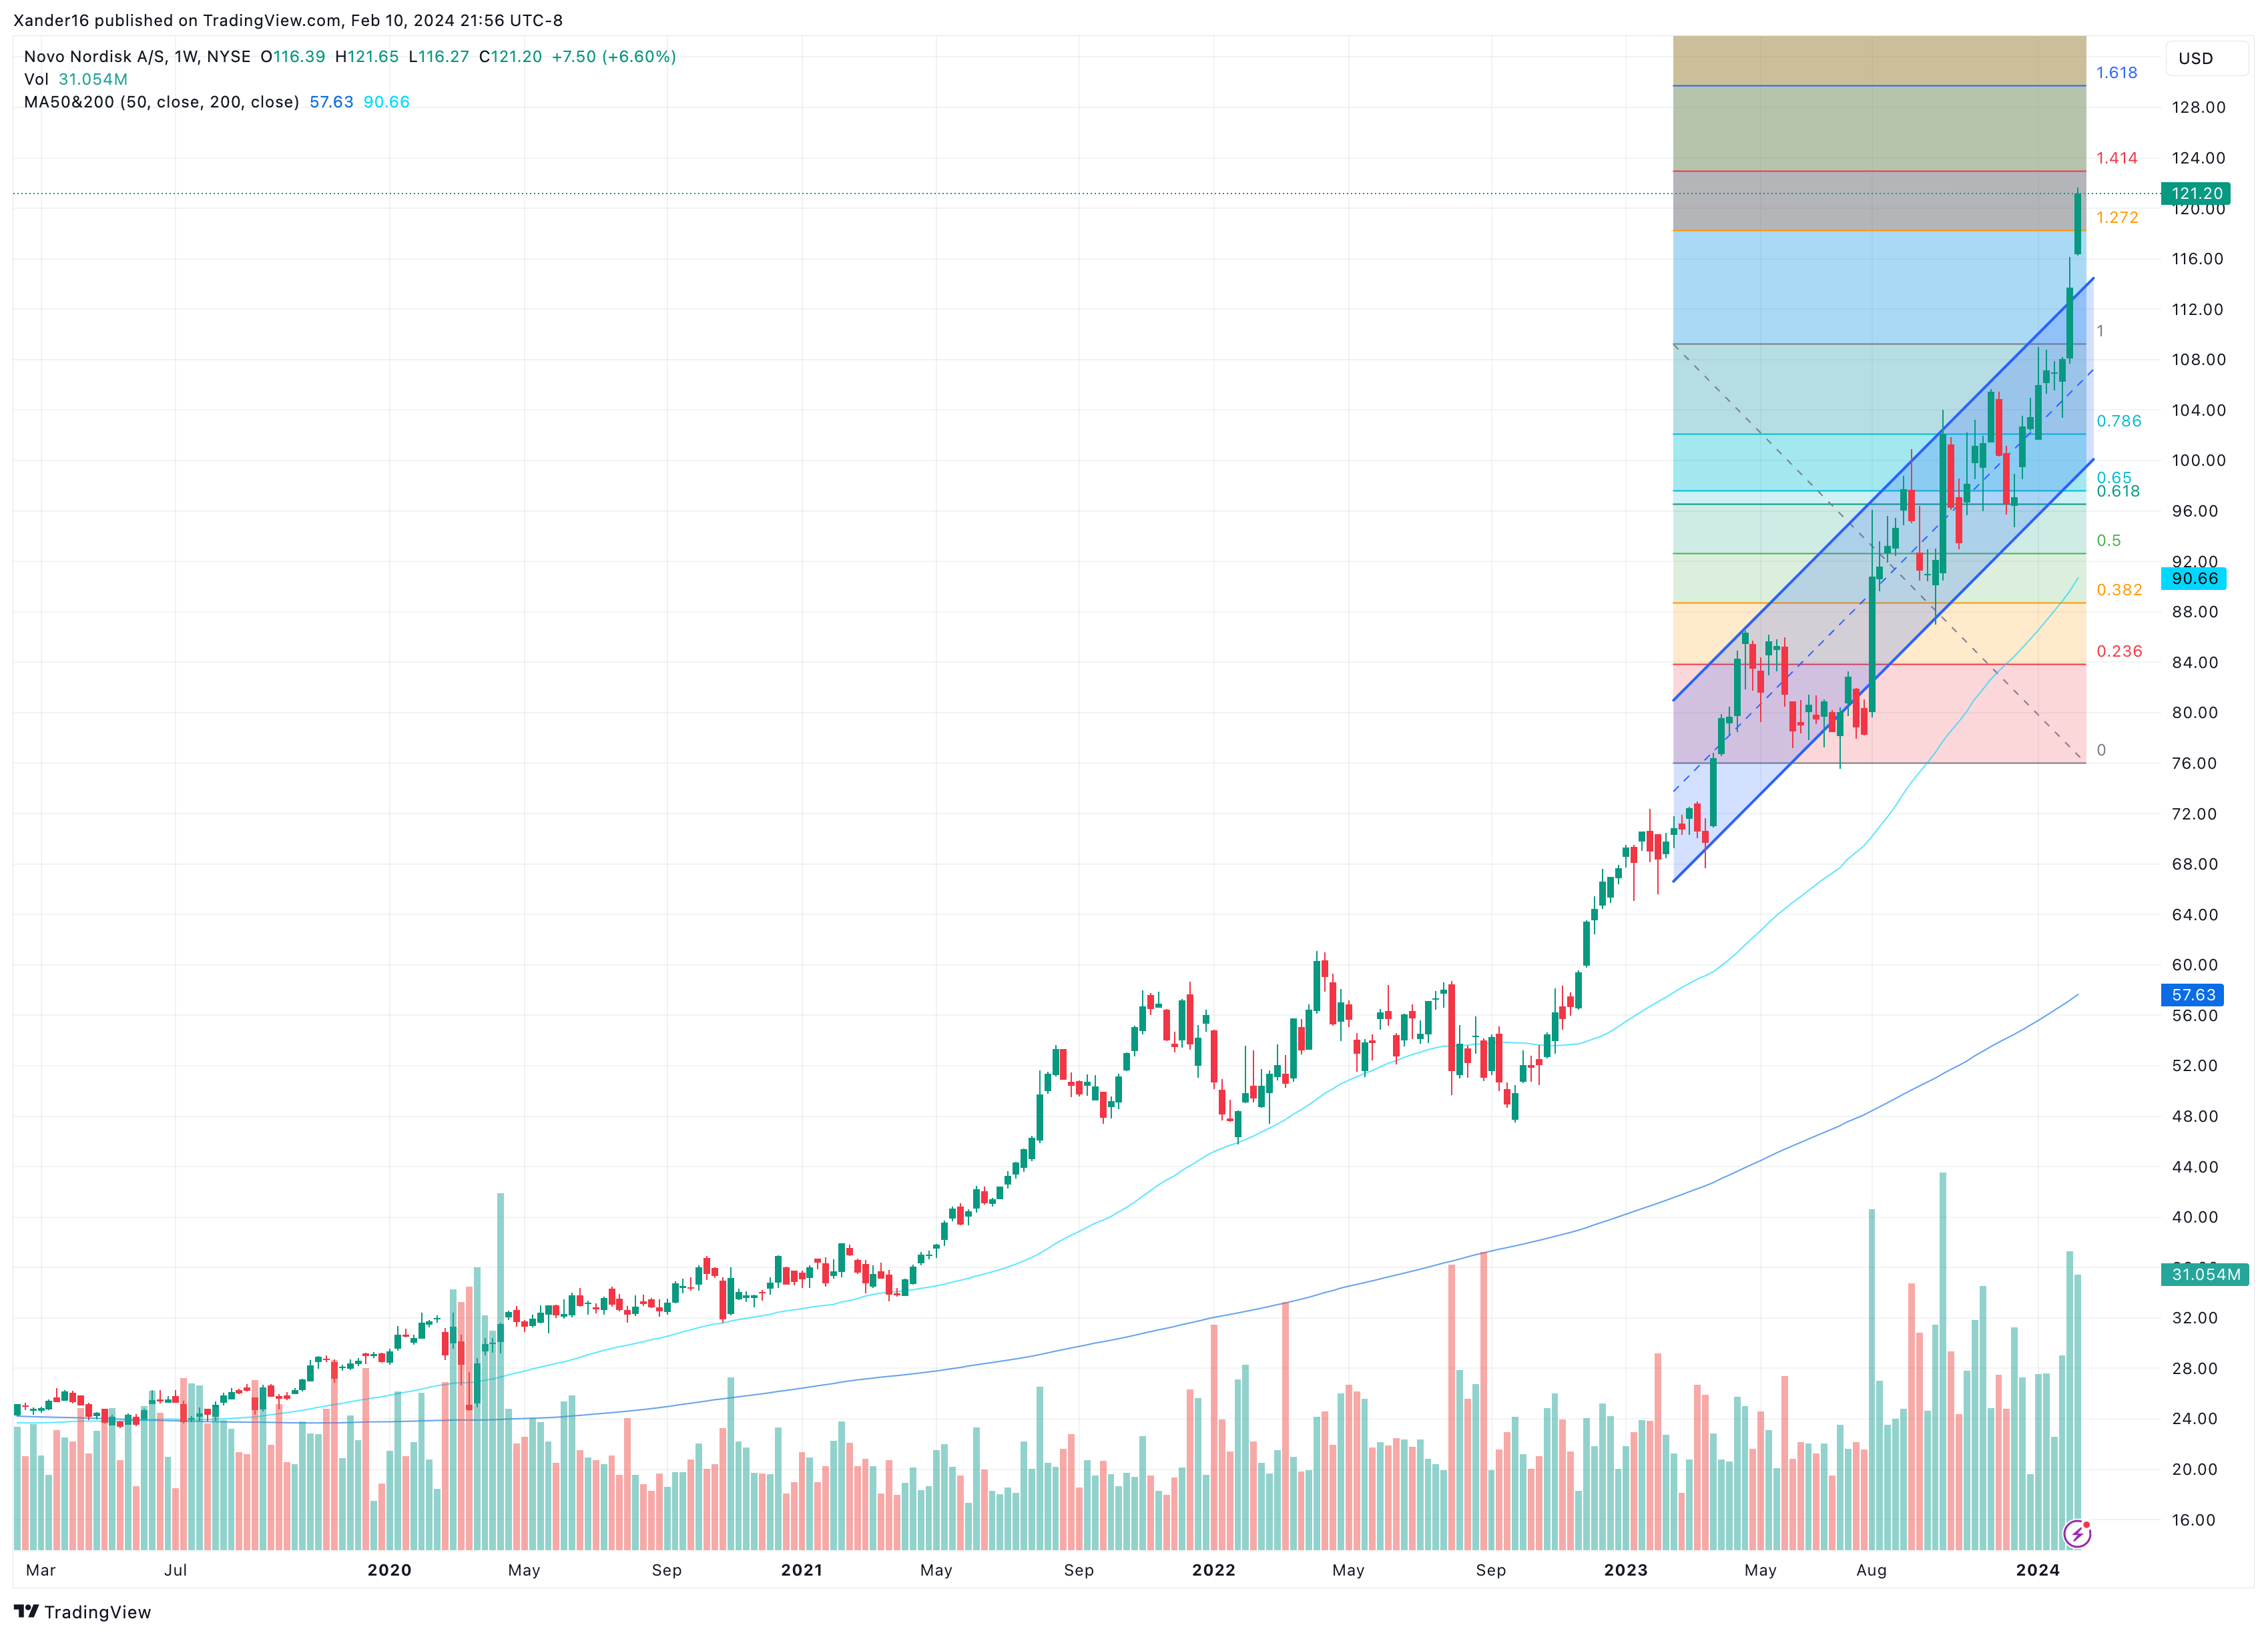 https://www.tradingview.com/symbols/NYSE-NVO/
The RSI, MACD and Bollinger Bands are just too high for $NVO for me to say go on a trade but the chart looks great. As much as the stock has gone up in the past year I would suggest it isn’t expensive yet as they have the numbers to support the valuation and a secular tailwind for strong growth. $NVO could yet rally up to the 1.618 Fib at ~$130 but at some point it needs to consolidate a bit and create a bull flag.
// A Peak Behind the Scenes of the Green Garage Investing Process
Normally I publish these reports behind a paywall for my Patreon subscribers.
Anyone can look at a chart and see if a stock is expensive or cheap, but analyzing the financial statements, doing qualitative research and coming up with an intrinsic value of the company, and thus a strike price so one can gauge the amount of margin of safety they are getting if they buy the stock at the current price, is a much more involved process.
Please reach out if you have any questions.
Regards and good luck to us all,
Alec