
TBH I find portfolio management one of the harder aspects of stock market investing. So many options to choose from.
Even if you only want to invest in 10 companies, which 10? How much in each? When to buy? Or sell? Is it blue chip, still not profitable but exciting, or is technology leaving them behind?
TL;DR
I am creating the Ultimate All Weather Portfolio to help retail investors like you and I simplify our stock portfolio management, outperform the markets, maximize our CAGR and generate resilient wealth. Please pass it on:
- Patreon // https://www.patreon.com/greengarage // free and paid tiers
Researching companies is fun. Or at least compelling if you are interested in their technology, products, etc. Crunching the numbers on the financial statements enables me to have a decent understanding of the biz and create a valuation that I can be reasonably confident in especially when paired with qualitative research. And maybe some technical analysis if you are into the dark arts 😉
But markets are fickle things. Market sentiment is the driving factor in whether a stock goes up or down, regardless of valuation. There is only one reason to buy a stock, even for the CEO of that company.
Market sentiment comes from an unquantifiable mix of behavioural economics, geopolitics, macro economics, inflation, interest rates, energy prices, debt levels, GDP, US dollar strength, politics, technology trends, industry events, company decisions, animal spirits, media, memes, pandemics AND etc.
Don’t believe me?
“Time in the market beats timing the market” is a common refrain for retail investors and Warren Buffett. (Quote is attributed to Kenneth Fisher).
I use what I call a strike price strategy. It is based in value investing fundamentals but with a healthy does of forward-looking growth investing. To paraphrase Morgan Housel, author of Psychology of Money: pessimism makes you sound smart, optimism makes you money.
The strike price strategy is an attempt to add some timing of the market to valuations. Buy quality when it’s on sale. Take advantage of market cycles.
In the short run the market can be a voting machine but in the long run it is a weighing machine. The problem is the long run can take a long time. E.g. $TSLA hit its ATH (all-time high) at $414.50 on Nov 1, 2021. That’s approaching 3 years ago — grrrr.
I think that situation will change within the next year as robotaxis and humanoid robots start rolling out, but as Keynes quipped, “markets can remain irrational longer than you can remain solvent.”
Sometimes you can’t fight the Fed and macro economic forces, but there are also ways to counteract with hedges, sector rotation and all-weatherizing. (More about All-Weatherizing a portfolio in the Watchlist section below.)
Diversification, as in primarily buying index funds, especially of the S&P 500, is a popular strategy to simply counteract market cycles. The problem is it leads to mediocrity in terms of portfolio performance. The past 20 years or so the S&P has returned about a 10% compound annual growth rate (CAGR) per year but it’s less than that over a longer period of time and occasionally there are lost decades, meaning it is below ATH for years.
One Up On Wall Street author and famous investor Peter Lynch teased that this approach is diworsification.
Remember that 10% is before inflation so knock at least 2% off of your real returns.
Here is what happens to your compounding at higher returns than the benchmark:
- $1000 @ 10% CAGR over 10 years = $2594
- $1000 @ 15% CAGR over 10 years = $4046
- $1000 @ 20% CAGR over 10 years = $6192
- $1000 @ 25% CAGR over 10 years = $9313
- $1000 @ 10% CAGR over 20 years = $6728
- $1000 @ 15% CAGR over 20 years = $16,367
- $1000 @ 20% CAGR over 20 years = $38,338
- $1000 @ 25% CAGR over 20 years = $86,736
You can read the full article here: Questrade Ad Blitz & Compound Annual Growth Rates
Remember the Rule of 72, a quick calculation to determine how long it takes to double an investment.
- 72 ÷ 5% = 14.4 years
- 72 ÷ 8% = 9 years
- 72 ÷ 10% = 7.2 years
- 72 ÷ 12% = 6 years
- 72 ÷ 15% = 4.8 years
- 72 ÷18% = 4 years
- 72 ÷ 20% = 3.6 years
- 72 ÷ 25% = 2.8 years
- 72 ÷ 30% = 2.4 years
- 72 ÷ 35% = 2 years
- 72 ÷ 40% = 1.8 years
- 72 ÷ 45% = 1.6 years
- 72 ÷ 50% = 1.44 years
I don’t know about you, but my goal is 15% or a double about every 5 years. Although I expect parts of my portfolio to outperform that.
There are companies that exceed that threshold over long periods of time. Not vast amounts, but enough, and they are often fairly well known companies, so the risk isn’t ridiculous, especially if you can buy them when they are lower in the/their market cycle (as opposed to company lifecycle stage) to maximize your CAGR.
There are also many companies that outperform this 15% but it tends to come with higher volatility and risk. I have capitalized on that but also been burnt chasing big returns. The burns hurt! But the hunt is alluring!!
Besides the strike prices, or margin of safety in Buffett parlance, another popular, for a good reason, strategy is to dollar cost average (DCA). If you are fortunate and/or astute enough with your spending to be able to consistently fund your trading account (a hundred a month or more if possible), without having to do the sell-this-to-buy-that dance every time, that is a great way to invest. It’s good to take profits sometimes (although HODLers often win in the long run), or sell a stock you are no longer feeling confident in (whether it is in the green or red), but it can be a much more complicated and thus time consuming way to invest. Ye olde portfolio management.
If you can incorporate strike prices, with DCAing and patience (buy at strike price, not whenever you add cash to your account, and have patience for time in the market) that is probably the best strategy for retail investors who are also busy with their real lives but want to maximize their CAGR and not just have mediocre returns.
That brings me to what I call my Green Garage Investing Strike Price List which is available to my Patreon subscribers for about the price of a somewhat fancy coffee per month.
The list is a spreadsheet with several different features in it. The service also includes my research articles. The spreadsheet is still a work in progress but it is definitely progressing!! 🙂
Here are some screenshots to show some of the features I have been developing to help retail investors, and myself, with portfolio management.
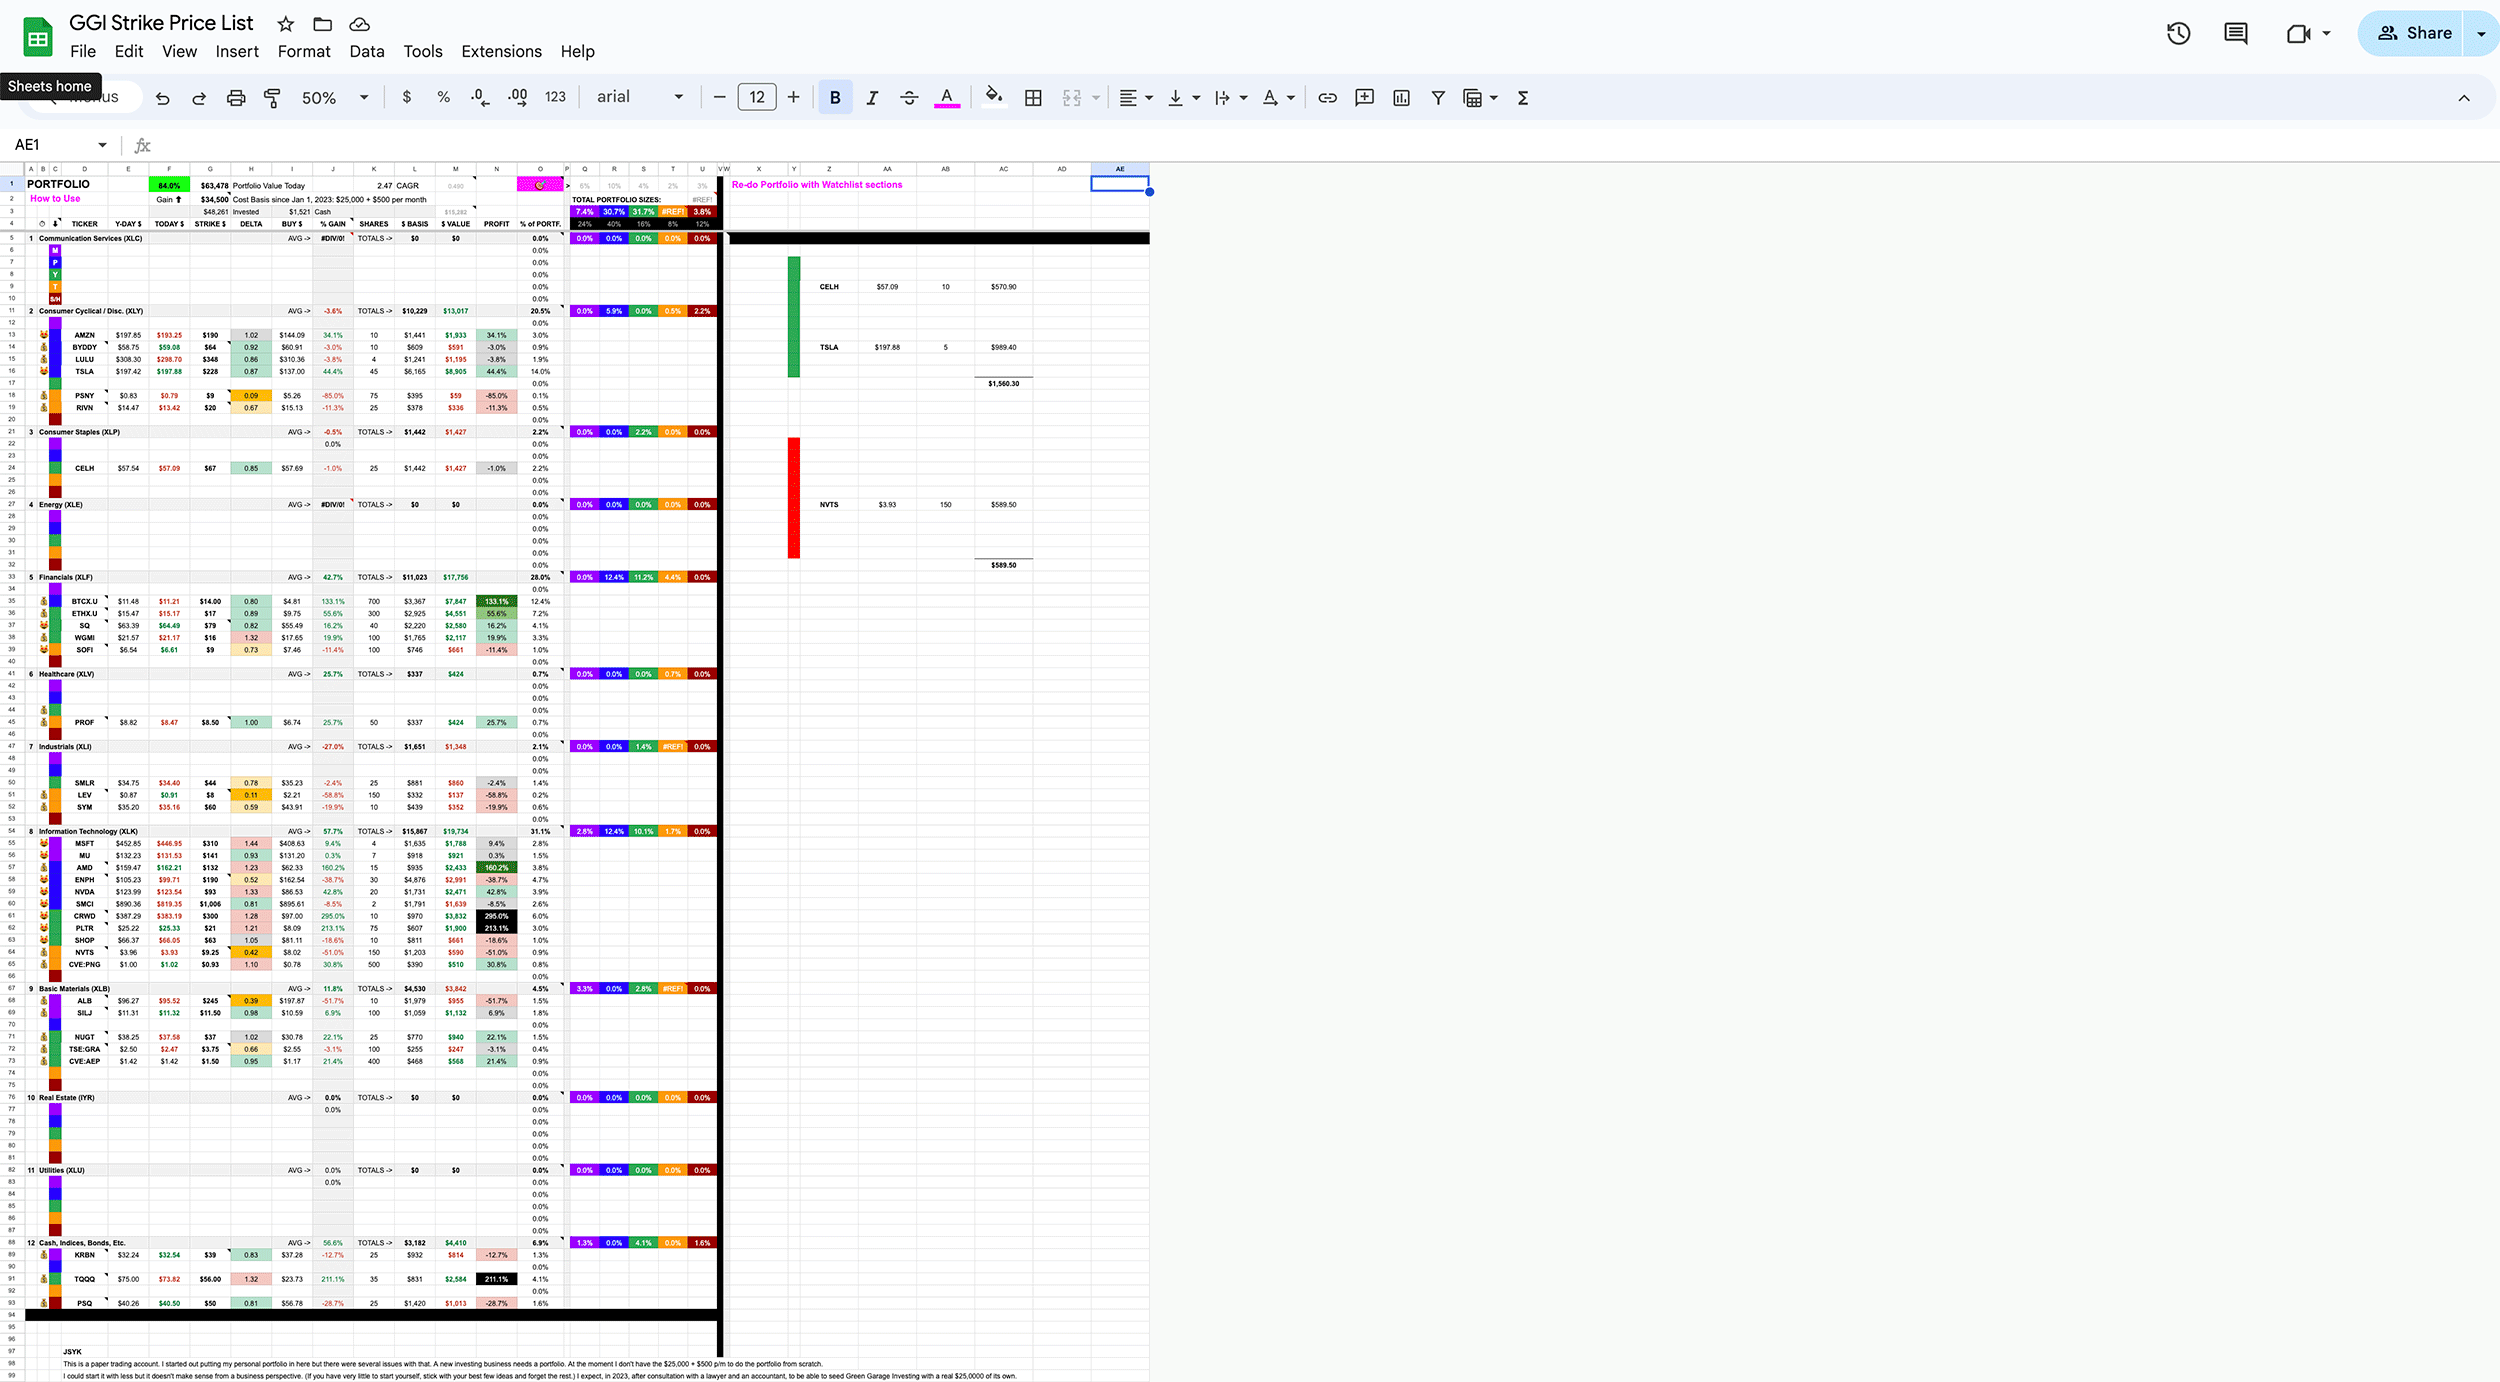
// The Green Garage Portfolio
Current holdings with results and allocations, etc. +90% in about 1.5 years. It could be better if I did less building the Green Garage Investing business and more portfolio management 🙂
// Buys & Sells
Note to Subscribers: You may want to check the transactions tab once in a while to see the portfolio moves I have made lately. I should probably post when I buy and sell. Will add it to the to-do-list.
![]()
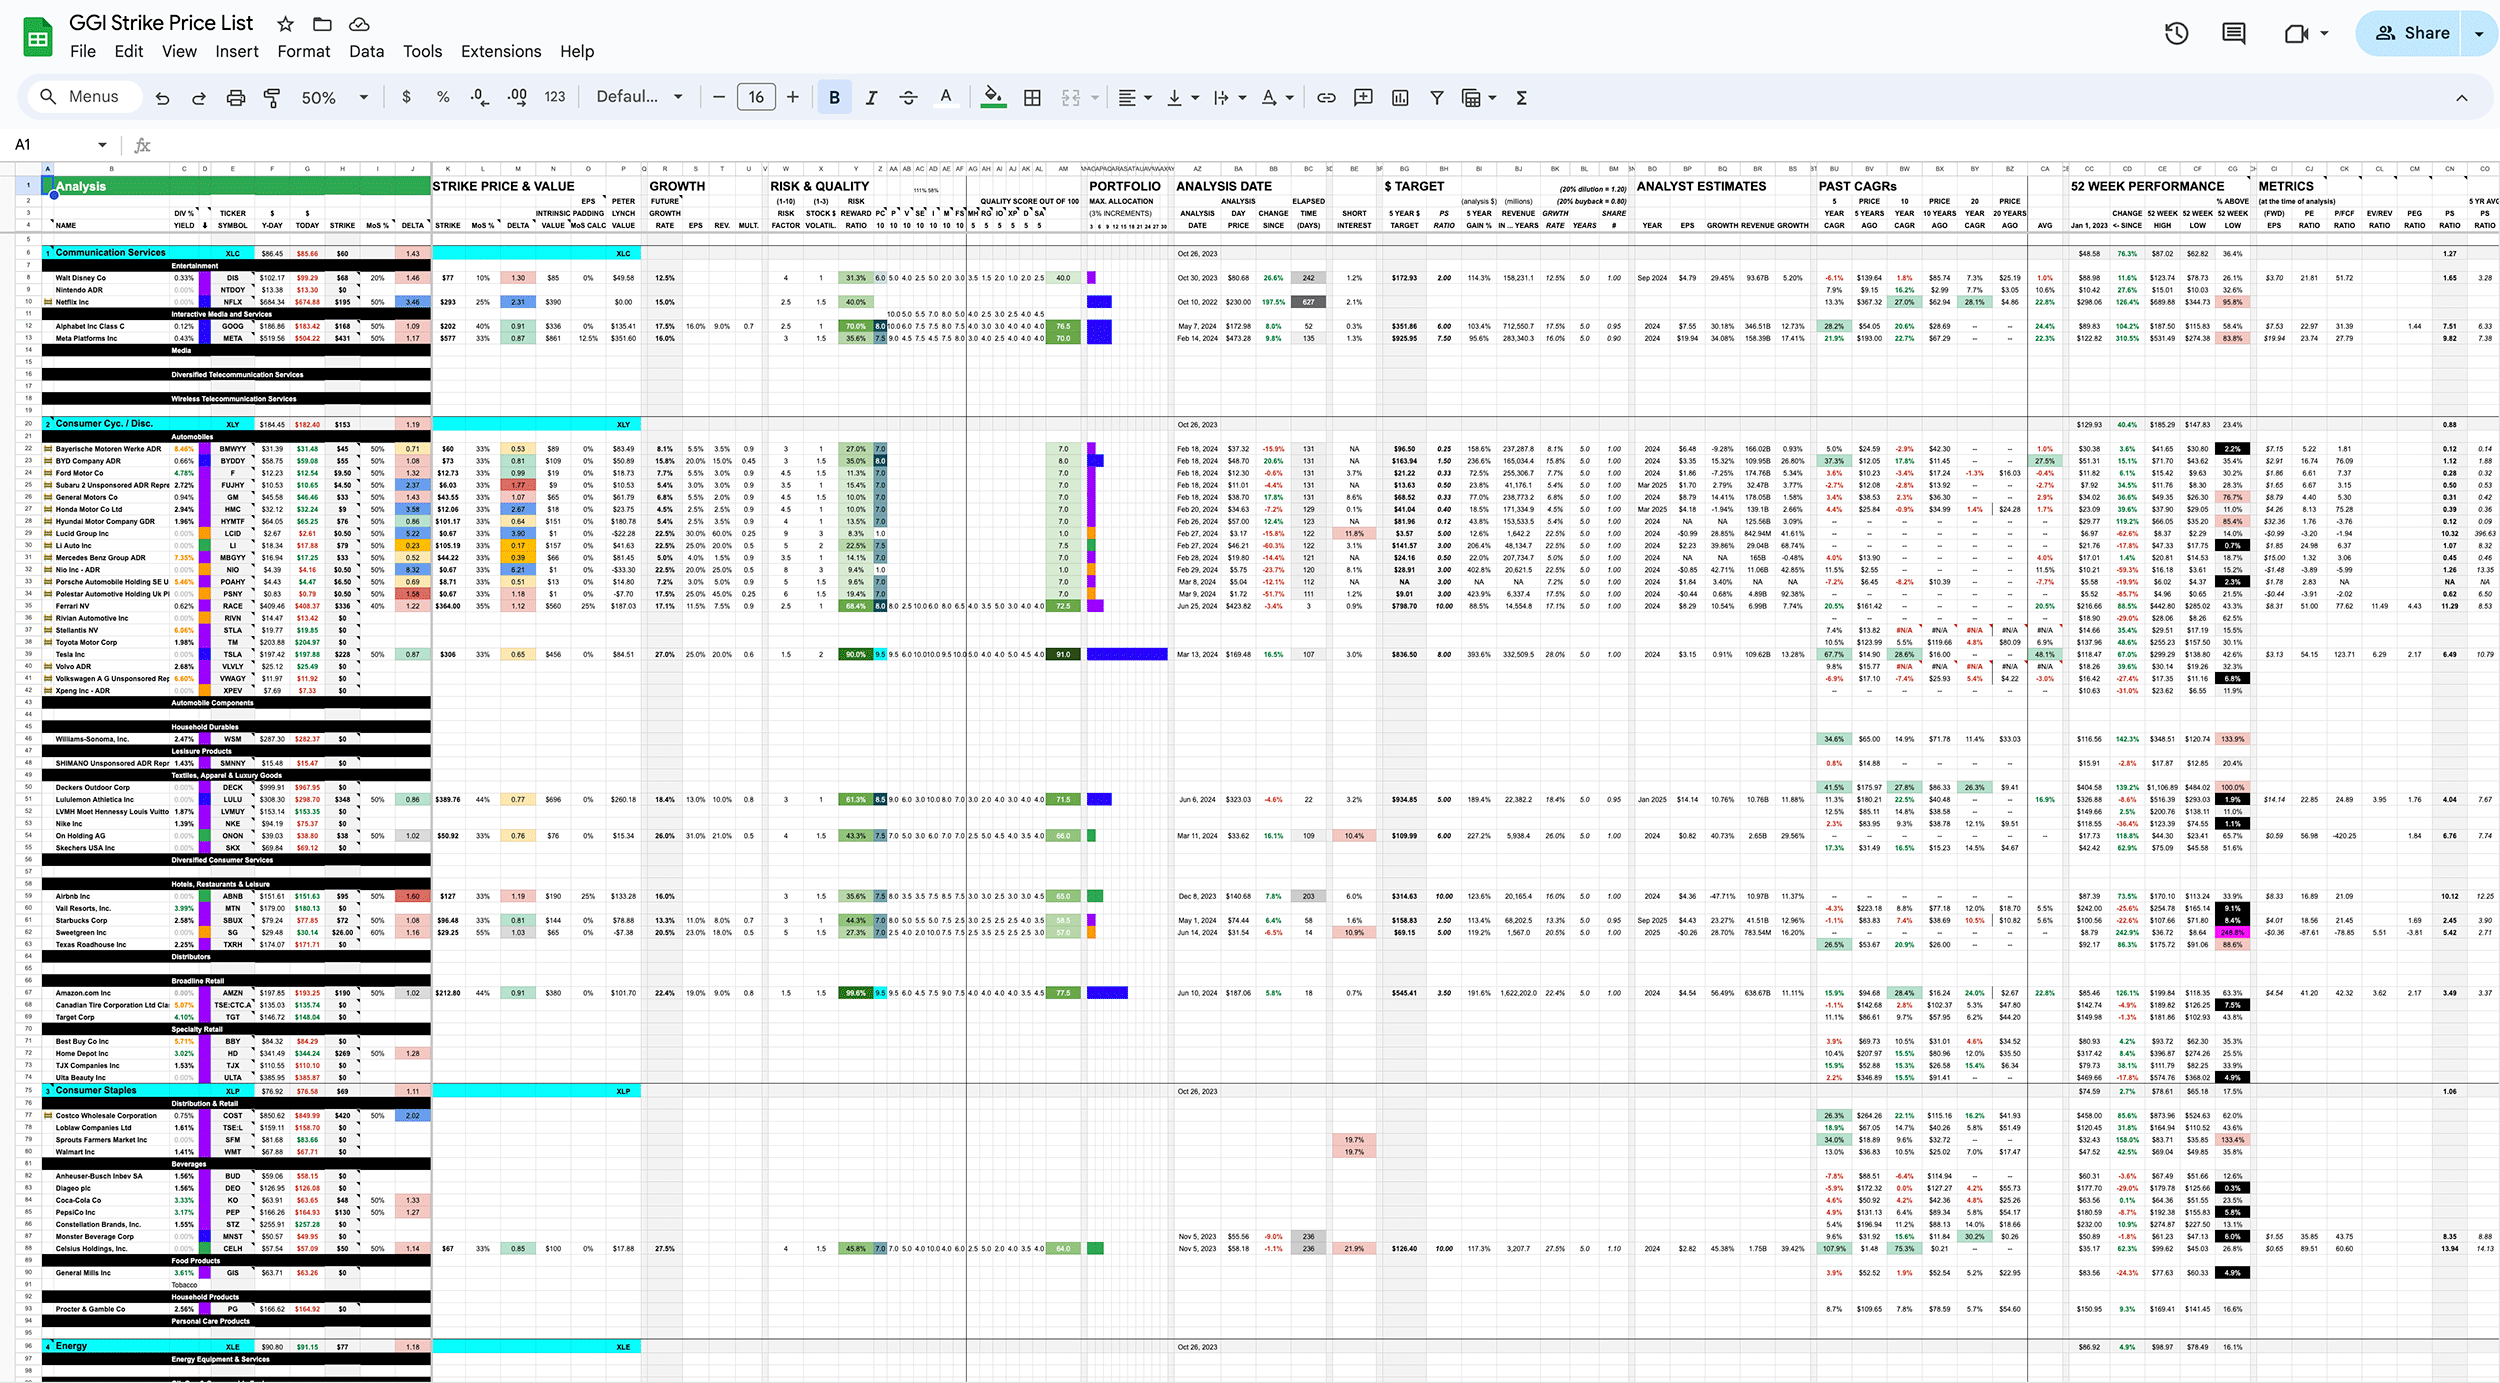
// Analysis
This is more for my own use when I do my research — there are better views for subscribers.
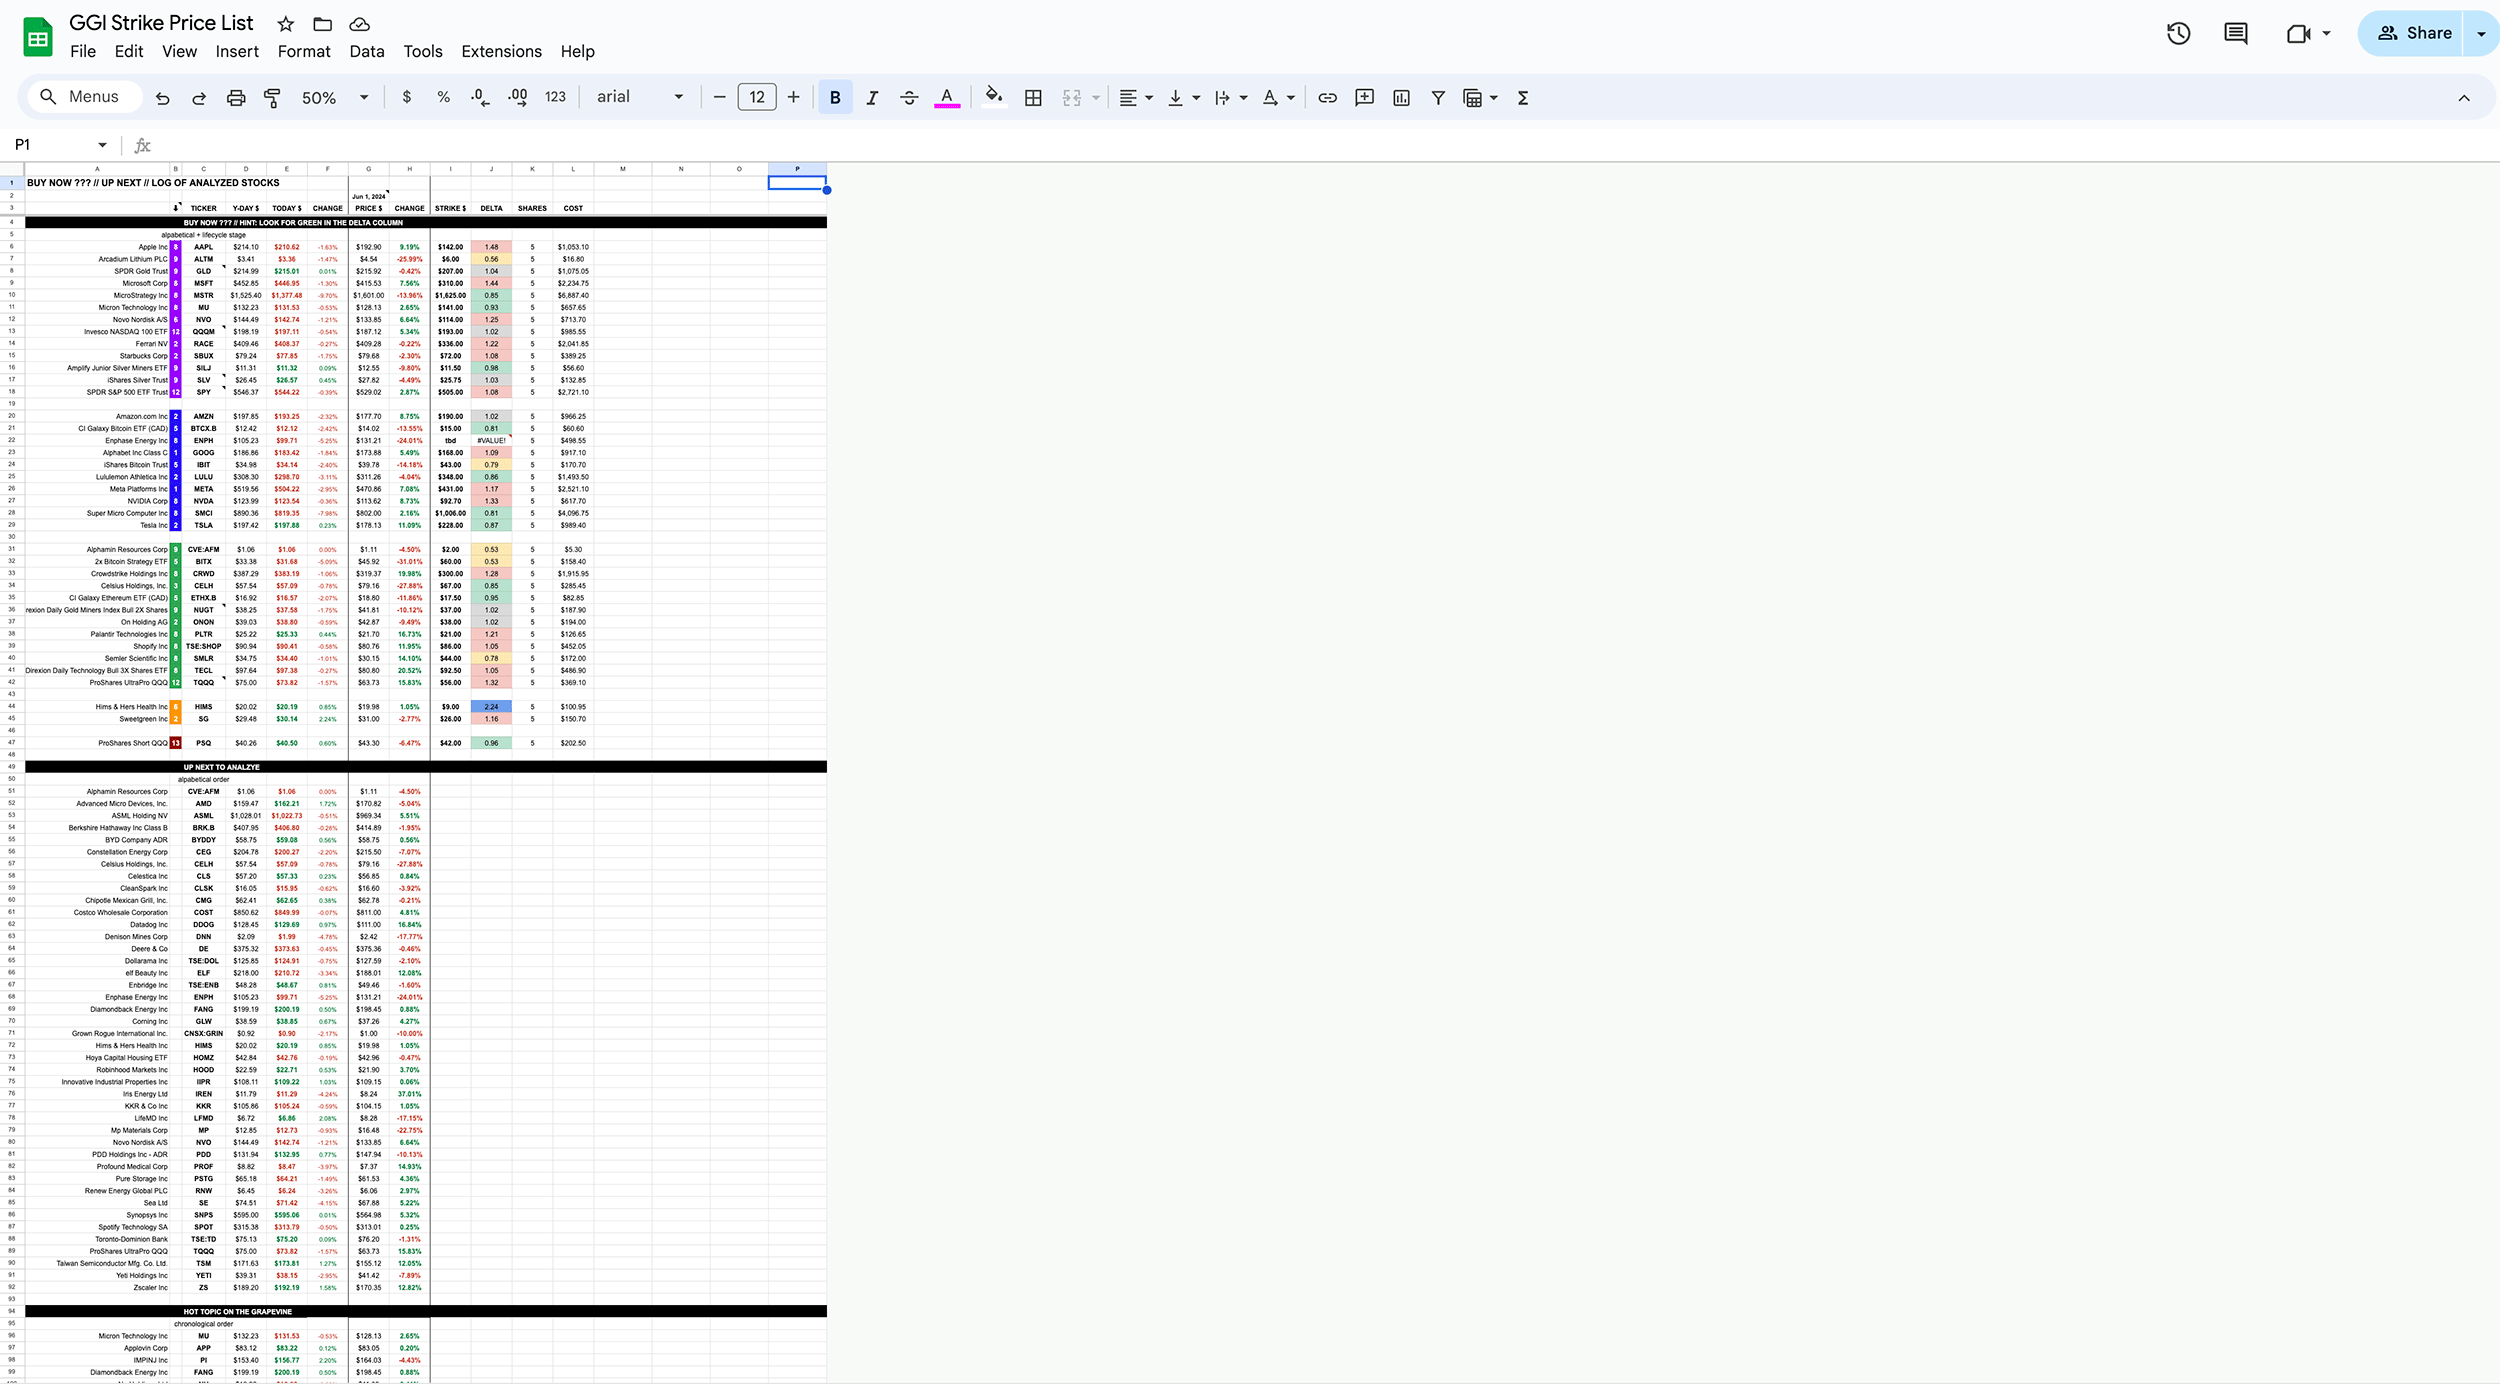
// Buy Now // Next to Research // Log of Stocks Researched
Buy Now is a watchlist that is divided up by company lifecycle stage as that can be an important factor in assessing, volatility, risk, reward and allocation size.
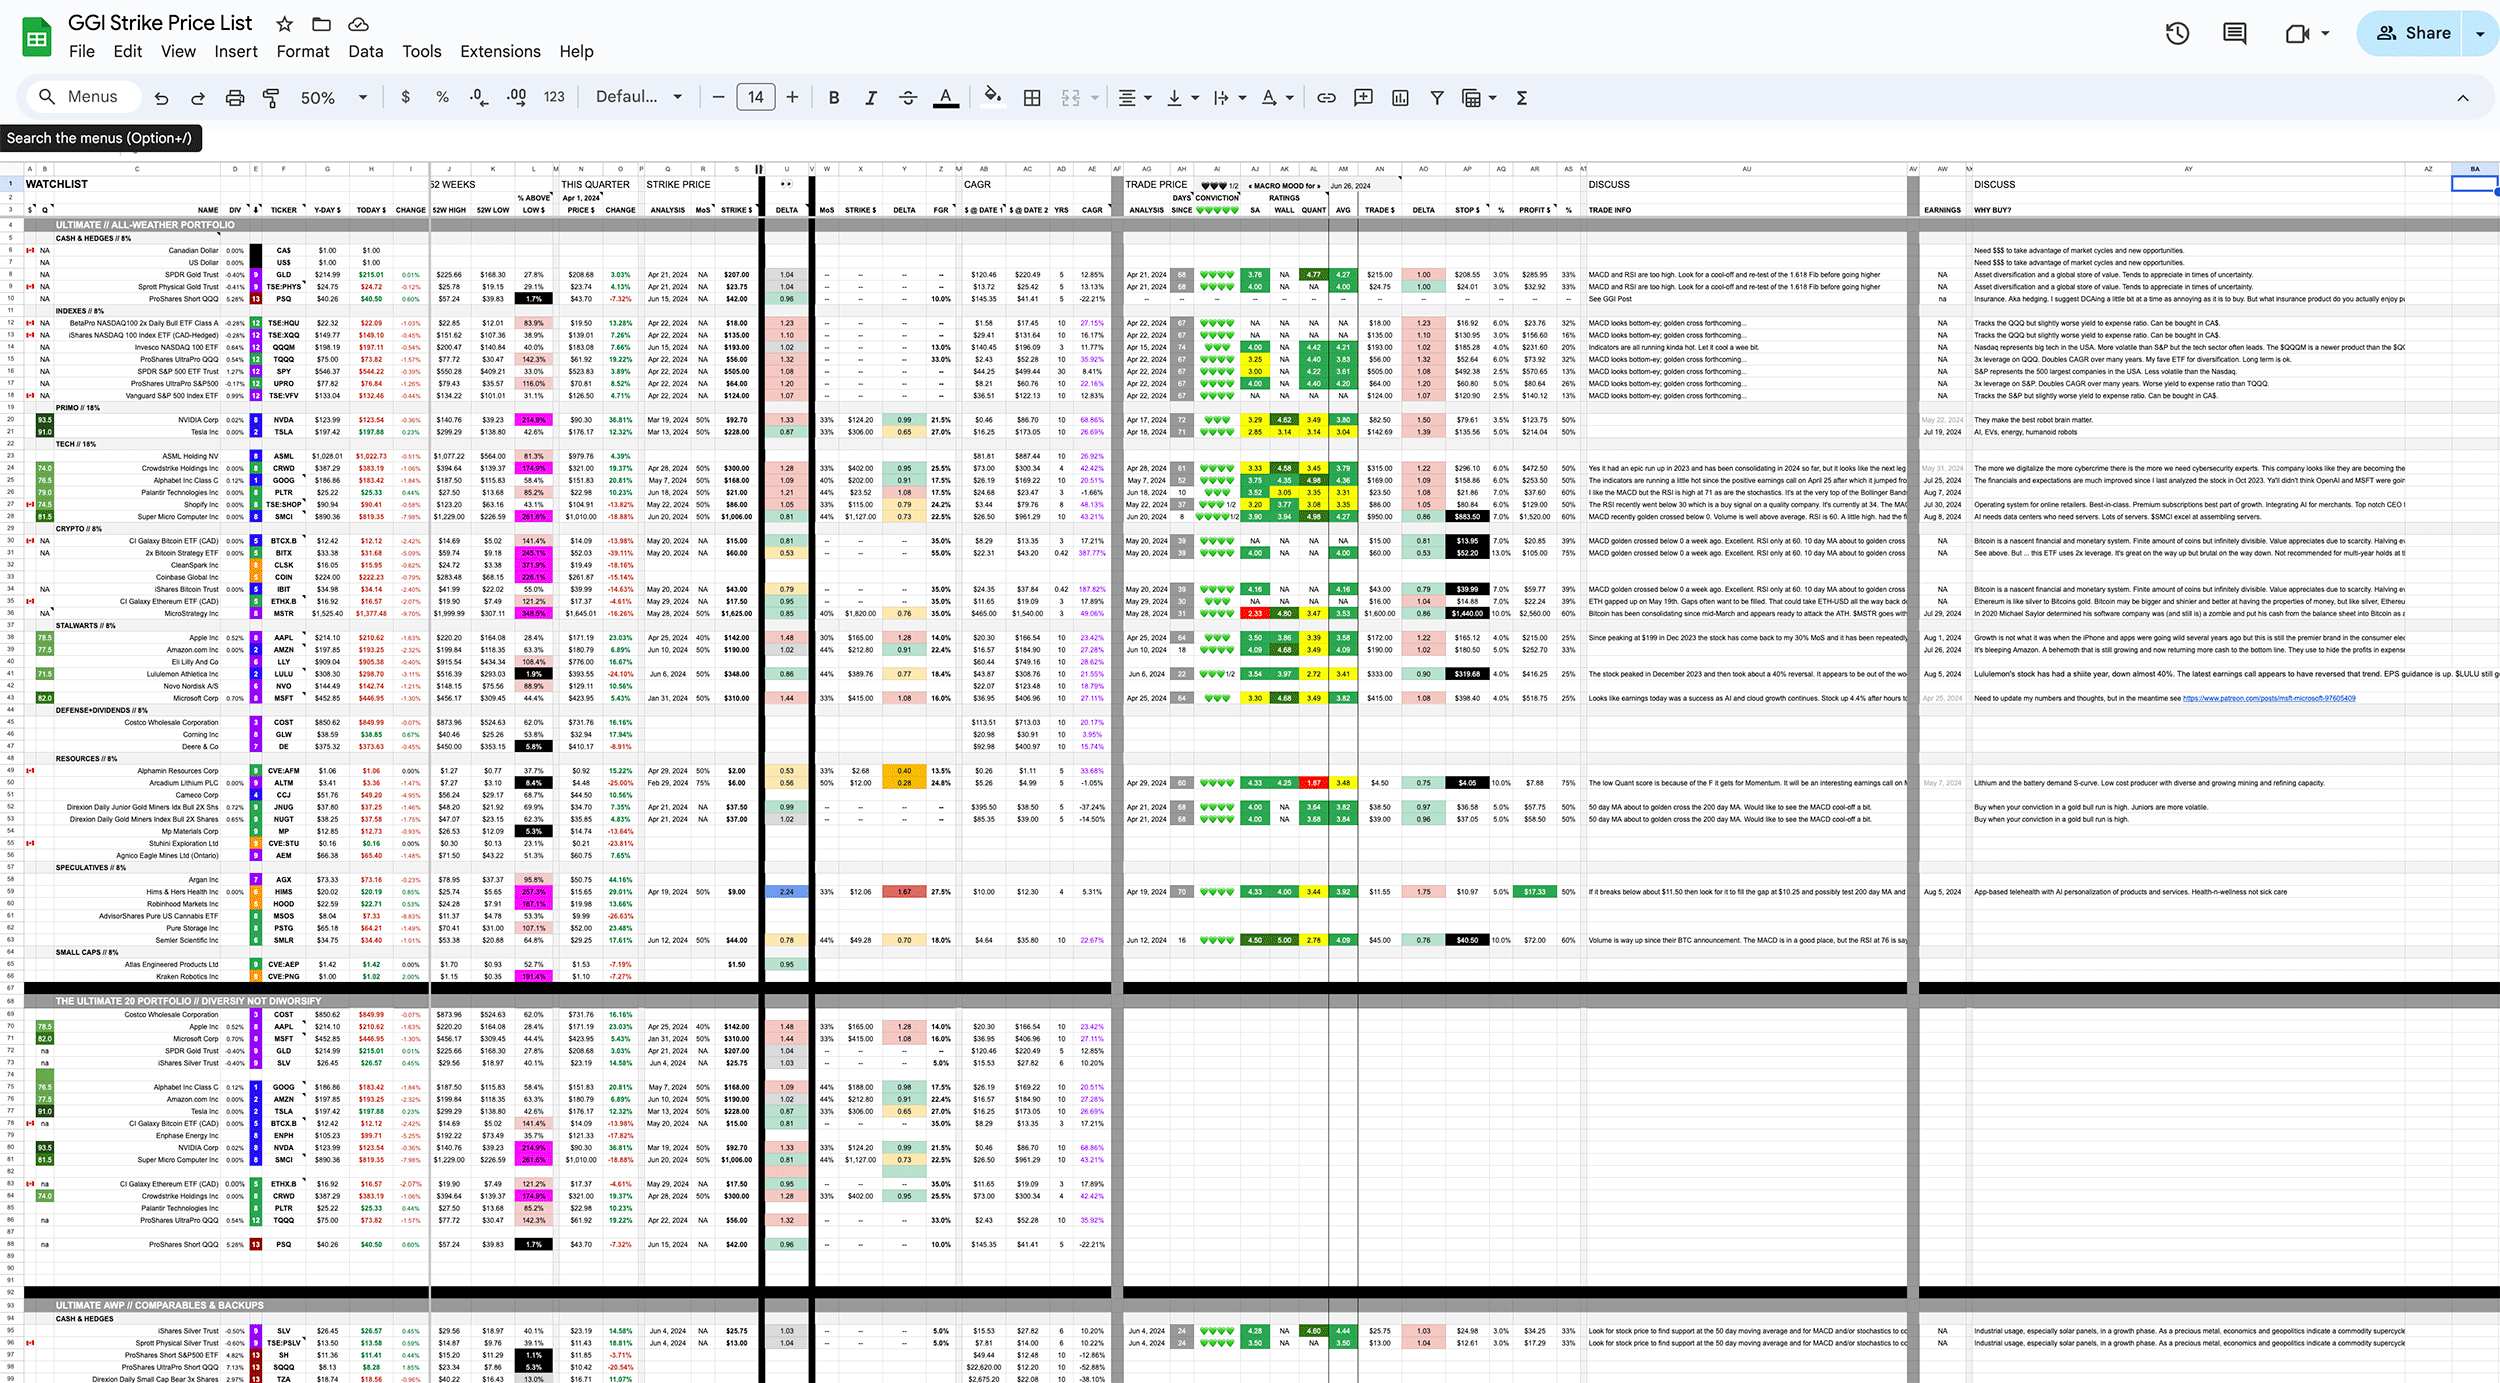
// Watchlist
This has my Ultimate All-Weather Portfolio recommendations based on 10 categories as well as my Ultimate 20 list, and a list of Ultimate Backups as not everything I research makes it into my Ultimate list but if it is a company you are fond of, it might be suitable for you.
10 Categories:
- Cash & Hedges
- Primo
- Tech
- Crypto
- Stalwarts
- Defense-Dividends
- Resources
- Speculatives
- Small Caps
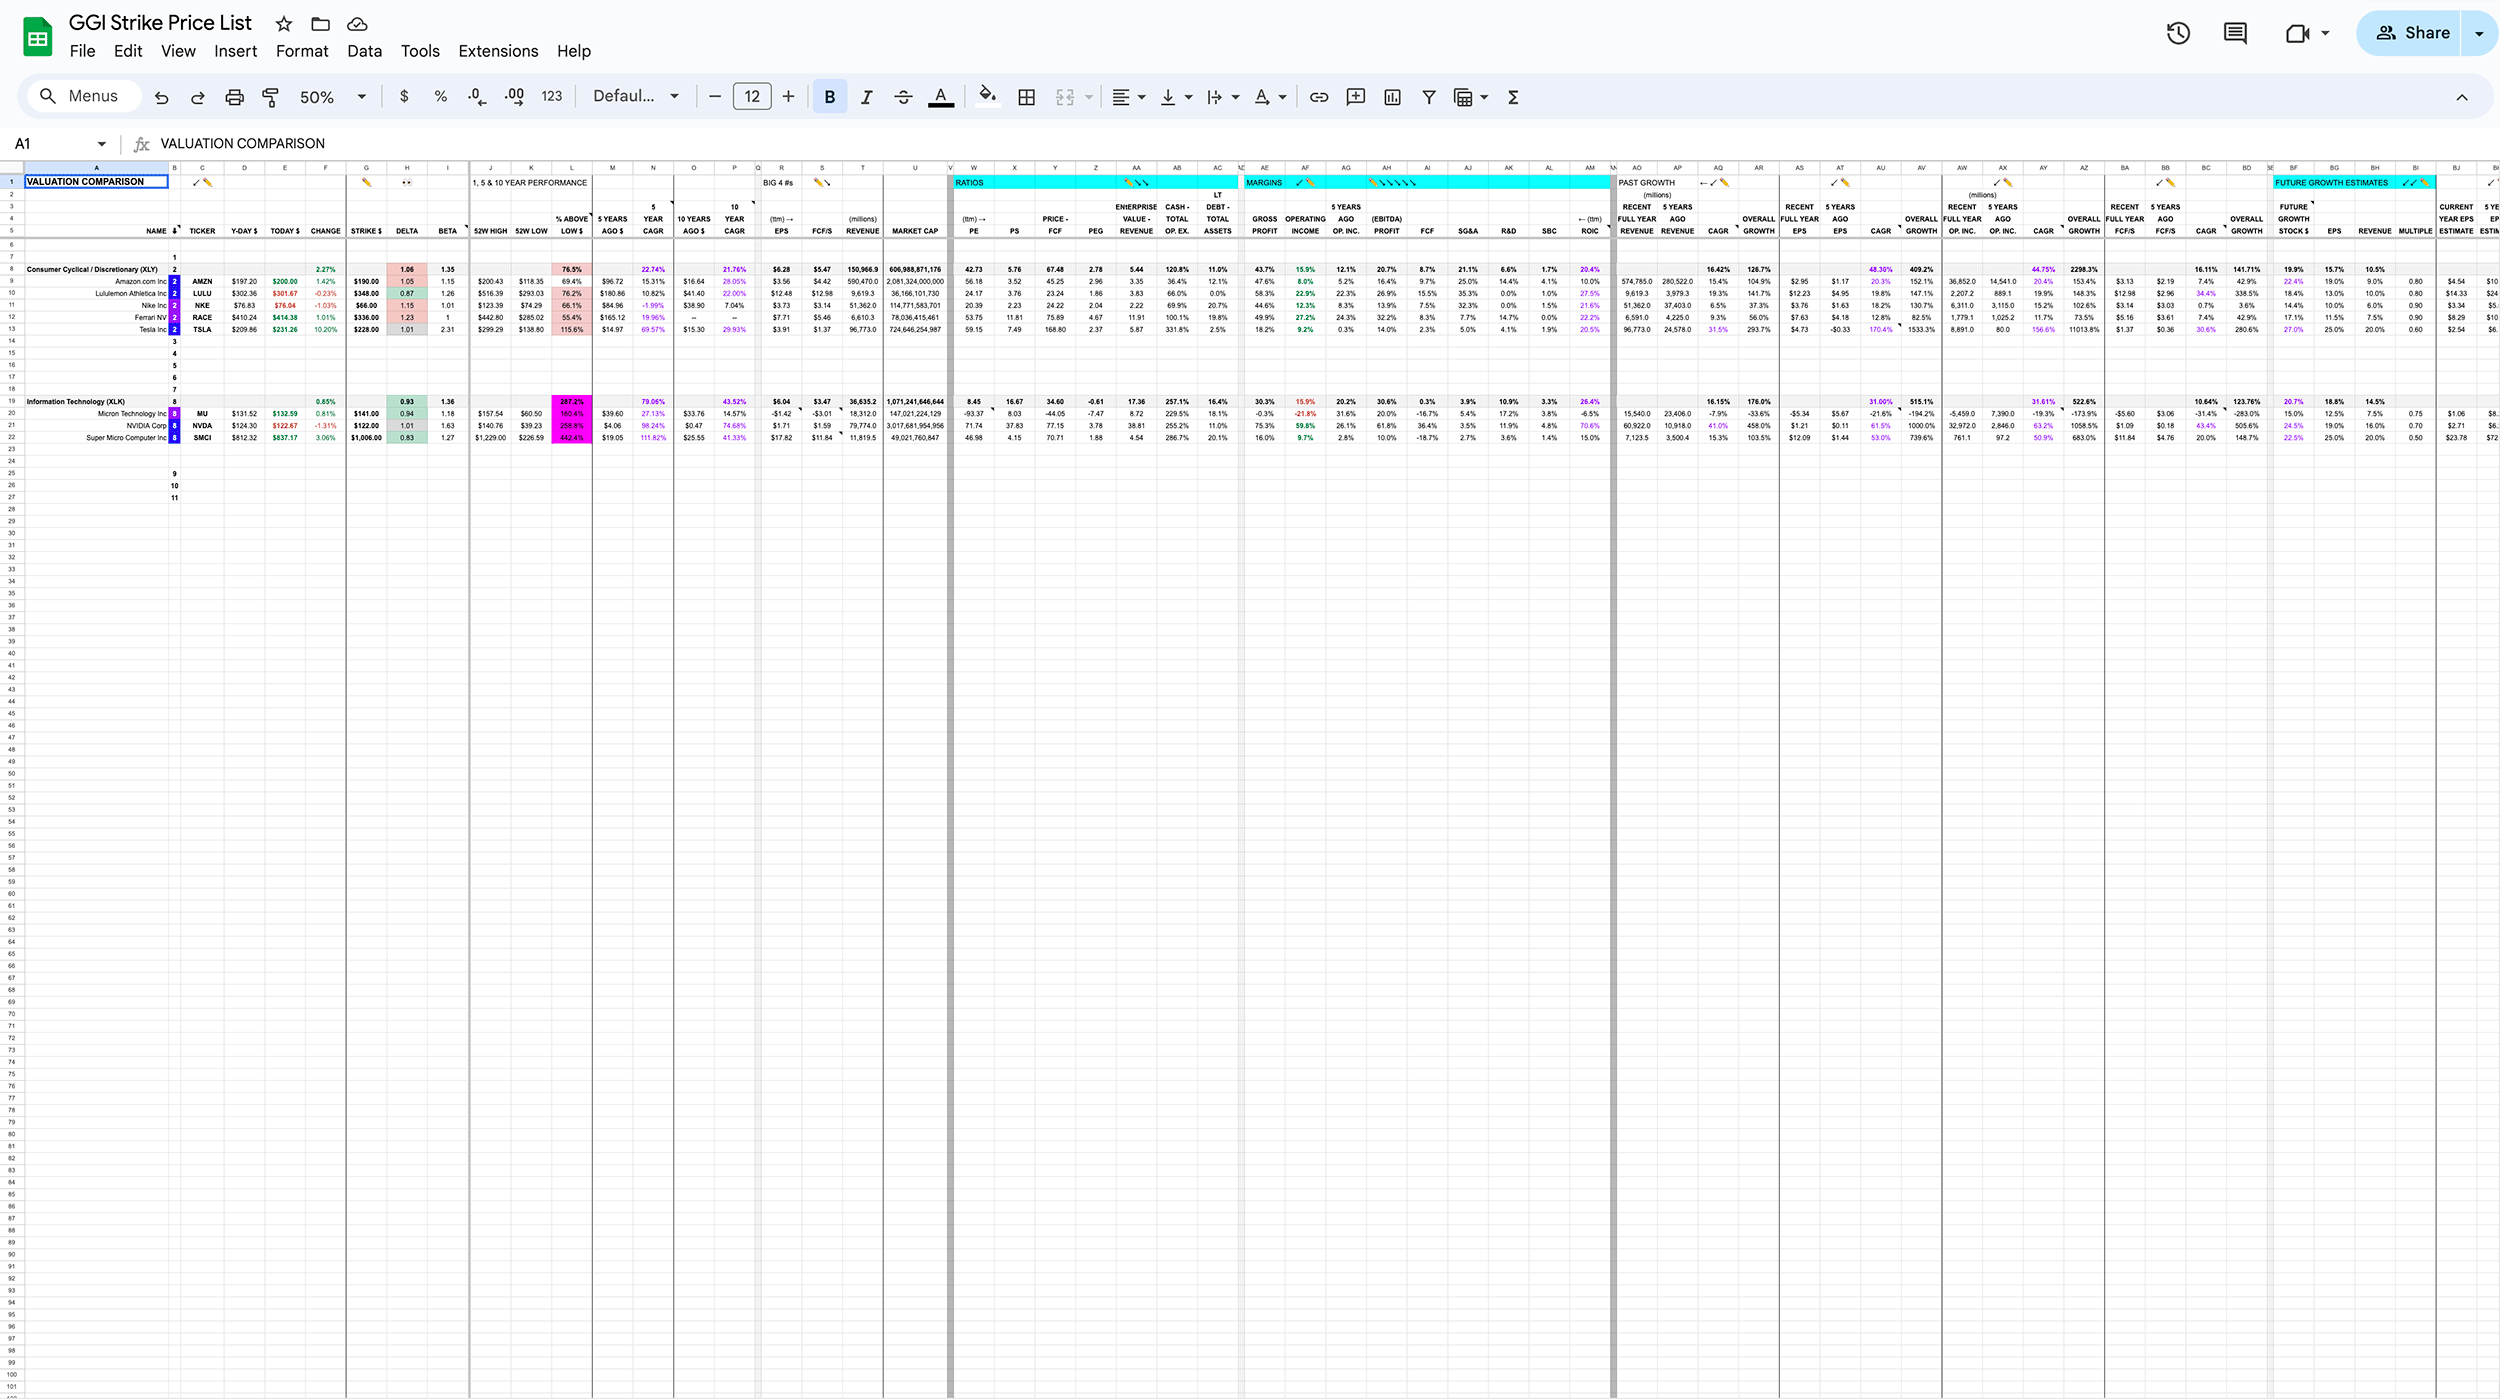
// Valuation Comparison
This is a recently started tab to easily compare metrics (eg operating income margins gross profit, free cash flow ratios, debt, R&D, past growth rates, future expectations, etc) to companies in each of the 11 sectors. This one still needs fleshed out a bit yet …
Anyways …
I regularly post on X (https://x.com/GreenGarageInv and https://x.com/AlecHomeDouglas), and Patreon (there are free and paid tiers — some articles vs all articles plus spreadsheet) and once in a while to my blog and the Canadian investor focused social media app, Blossom (handle @greengarage). I generally don’t bother people on Facebook, Insta and LinkedIn with investing posts accept once in a while with posts like this to drum up subscribers.
Use the above links if you feel like following along with my research.
(One day I hope to have a YouTube channel but I’m gonna need recruits for that endeavour. 🙂
This project is a work in progress but I think it is starting to get somewhere good and thus useful to y’all.
Cheers and good luck to us all,
Alec
P.S.
If stocks aren’t really your thing but ya know somebody who might be interested, please pass this article along.
My Links
- Patreon // https://www.patreon.com/greengarage // free and paid tiers
- Strike Price List: Patreon Subscriber Access // https://www.patreon.com/posts/strike-price-75643789
- X @GreenGarageInv // https://x.com/GreenGarageInv // fka Twitter
- X @AlecHomeDouglas // https://x.com/AlecHomeDouglas // fka Twitter
- GGI Website // https://greengarageinvesting.com
- Blossom @greengarage // https://www.blossomsocial.ca
- Linktr.ee // https://linktr.ee/greengarageinvesting
In Summary
I am creating the Ultimate All Weather Portfolio to help retail investors like you and I simplify our stock portfolio management, outperform the markets, maximize our CAGR and generate resilient wealth. Please pass it on:
- Patreon // https://www.patreon.com/greengarage // free and paid tiers
Bonus
I posted my latest article about Nvidia on July 2nd. It is not behind the subscription paywall so everyone can read it to get a sample of my work.
// THESIS
Nvidia make robot brain matter and are thus now a humanoid robot company.
The stock is up over 725% since Jan 1, 2023 and 149% since Jan 1, 2024.
Continue reading: https://www.patreon.com/posts/nvda-nvidia-107350051

Cover image: https://venice.ai


")
