
A comparison study of the financials of BMW, BYD, Ford, GM, Hyundai, Mercedes, Stellantis, Tesla, Toyota and VW with projected stock prices for the end of 2024.
Warning: 8 of 10 are potential value traps.
This is a quantitative analysis, not qualitative and therefore is not a complete picture. The purpose is to show what the financial numbers are projecting and to help you invest in where the puck is going and not in where it has been. This is not part of our Strike Price List (you need to subscribe for that and we use different evaluation methods). This is in some ways a response to the Tesla is over-valued by stupid retail investors narrative we so often come across. That FUD is keeping retail investors from, arguably, the best investment opportunity of this decade.
The auto OEMs that can significantly increase their EV to non-EV production ratios could change the dire outcomes this model forecasts, but that is beyond the scope of this study. However, it should be noted, that it is extremely difficult for a mature company to disrupt their legacy business. Only the best will be able to achieve this feat and not be bought out or go bankrupt.
The spreadsheet is very long so it is broken into 8 images. We will provide what we think are the highlights. PDF of the spreadsheet →
Image 1:
- The 10 companies in alphabetical order with the stock price at close on April 5, 2023 and their trailing twelve month earnings per share, EPS(TTM).
- Ford is the only company that was not profitable in the past year.
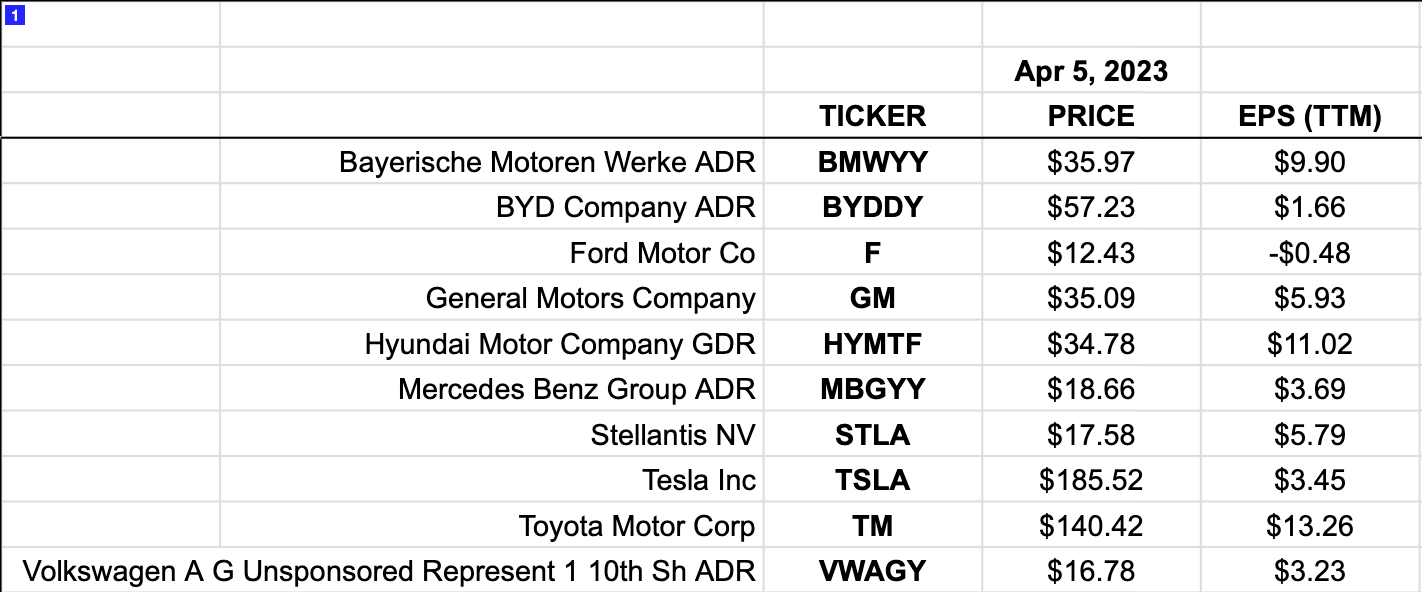
Image 2:
- EPS(FWD) is average analyst projections for earnings this fiscal year and we noted the change from the EPS(TTM). Ford should rebound a lot and only Stellantis is expected to decrease earnings.
- The PE ratios are very low for most of the companies, except for Tesla at 53.77 and BYD at 34.48. Current average for the S&P 500 is 21.94 and the historical average is about 15.
- Tesla has about 3x the market cap of Toyota, the second largest manufacturer.
- Toyota and VW have over 3x the sales revenue of Tesla and over 4x that of BYD.
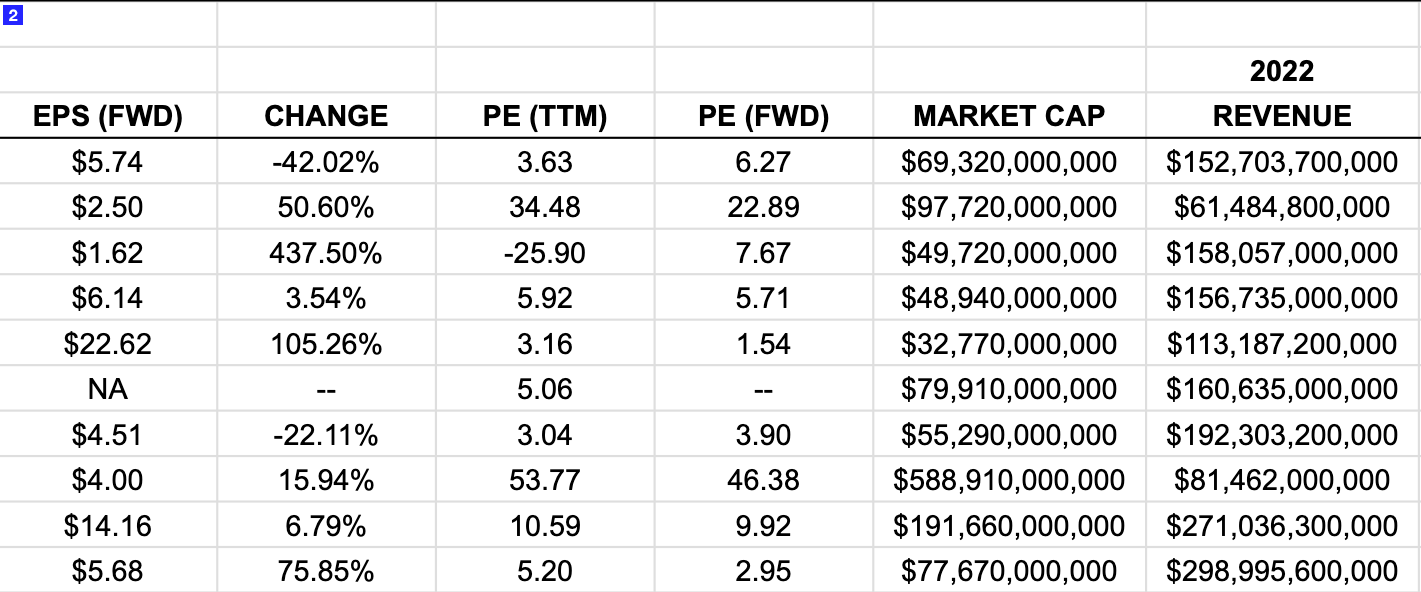
Image 3:
- All the companies have a very low price-to-revenue except for Tesla at 7.23. The S&P 500 average is currently 2.39.
- We note the 2013 revenue and provide a CAGR (compound annual growth rate). Tesla stands out having grown sales revenue 44.78% per year the past decade. BYD 21.55% and the rest below 4%.
- We note the stock prices on April 5, 2013 (2017 for Mercedes and Stellantis) and the CAGR. Tesla’s stock price has increased 52.32% a year, BYD half that and most others under 3%. If you’re an investor in the sub 3% companies at least you might be getting a dividend, but is that really worth it?
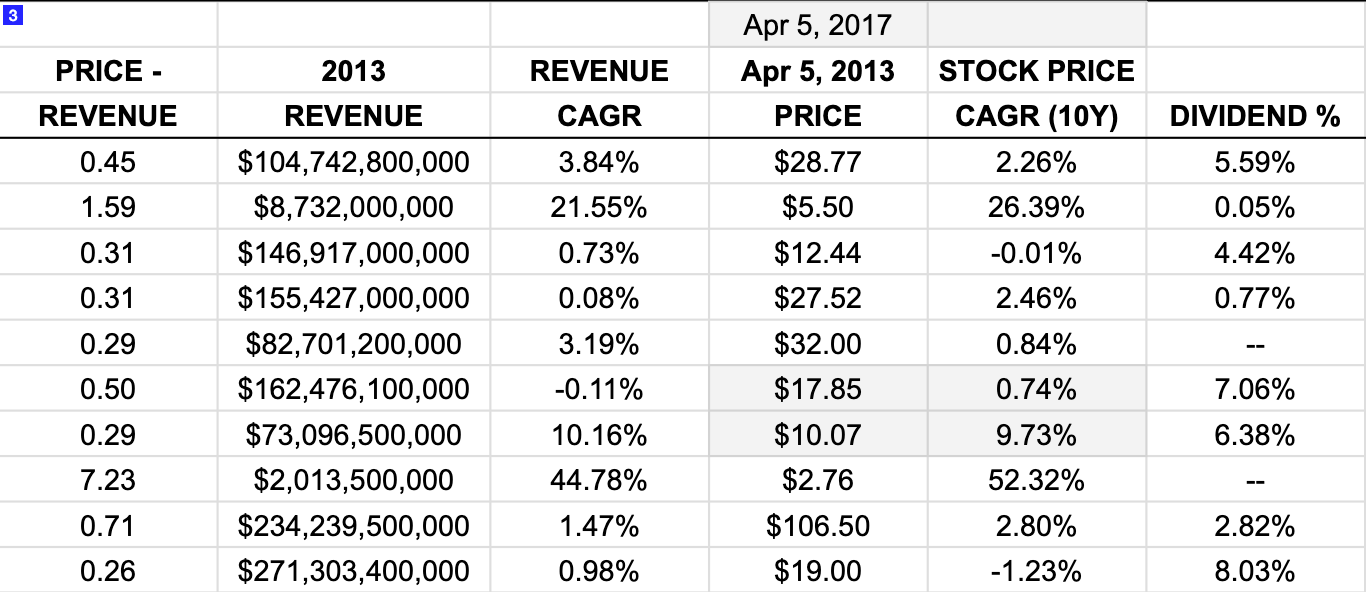
Image 4:
- Peter Lynch, the famous hedge fund manager, had a quick-n-easy valuation method: Peter Lynch Fair Value = Earnings per Share * Earnings Growth. We amended it a little to make it EPS(TTM) + Dividend * 15 (the average historical S&P 500 PE ratio.)
- Tesla is well above the Delta-PLV at 3.09 as the fair value would only be $60. Besides BYD all others are well below the fair value using this method.
- Next we look at operating income: the adjusted revenue of a company after all expenses of operation and depreciation are subtracted. Tesla stands out at 16.81% operating margin. The other 9 companies have an average operating margin of 7.5%.
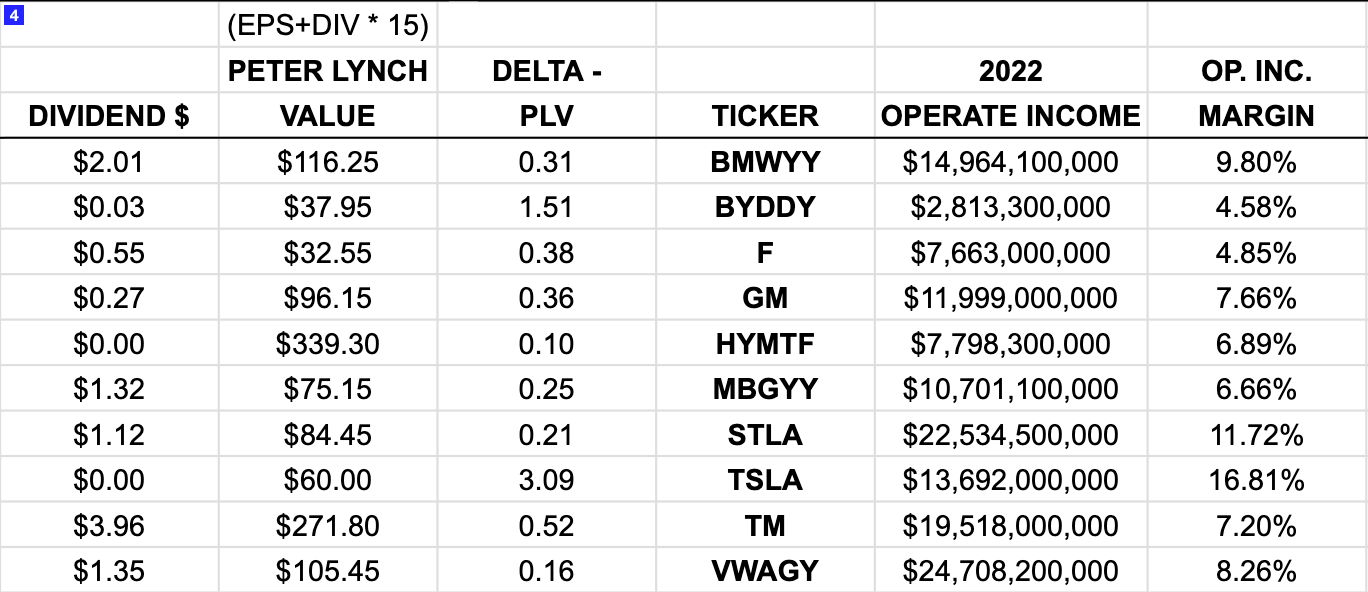
Image 5:
- Next we note the 2013 operating income and the resultant CAGR. Tesla had a negative margin in 2013 so the formula doesn’t work for them but they went from -$61M to $13.7B. Ford went from $13.2B to $7.7B in 2022.
- Then we look at total assets to long-term debt. Tesla and BYD are at just over 1% asset to debt ratio. Hyundai and Toyota are over 20%. Ford is surprisingly mediocre at 7.31%.
- Tesla has $22B in cash & equivalents and VW a surprising almost $60B.
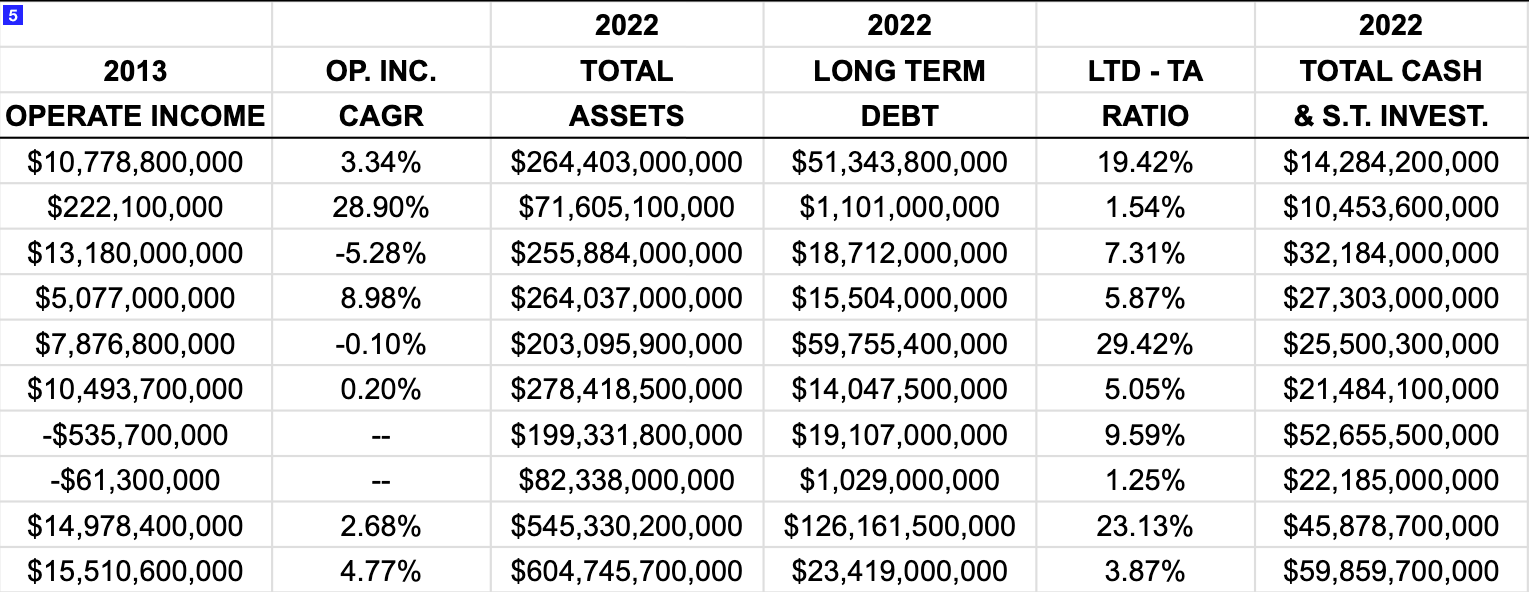
Image 6 (now it starts to get interesting):
- The Altman Z Score is a formula that predicts the probability that a firm will go into bankruptcy within two years. 1.8 or below is considered to be in distress. Tesla is a whopping 11.7, Mercedes and VW are comfortable 5-ish and the rest are very close to or well below the 1.8 threshold.
- Let’s ignore the change in free cash flow from 2019 to 2022, but you can see who is actually putting money in the bank at the end of the day here. Ford, GM and Toyota are currently failing to bank any cash.
- Ignore the price to free cash flow per share for Ford. The rest are accurate with Tesla standing out for being high and thus over valued and Toyota in the negative.
- Next we have the 2024 analyst EPS estimates for 7 of the 10 companies.
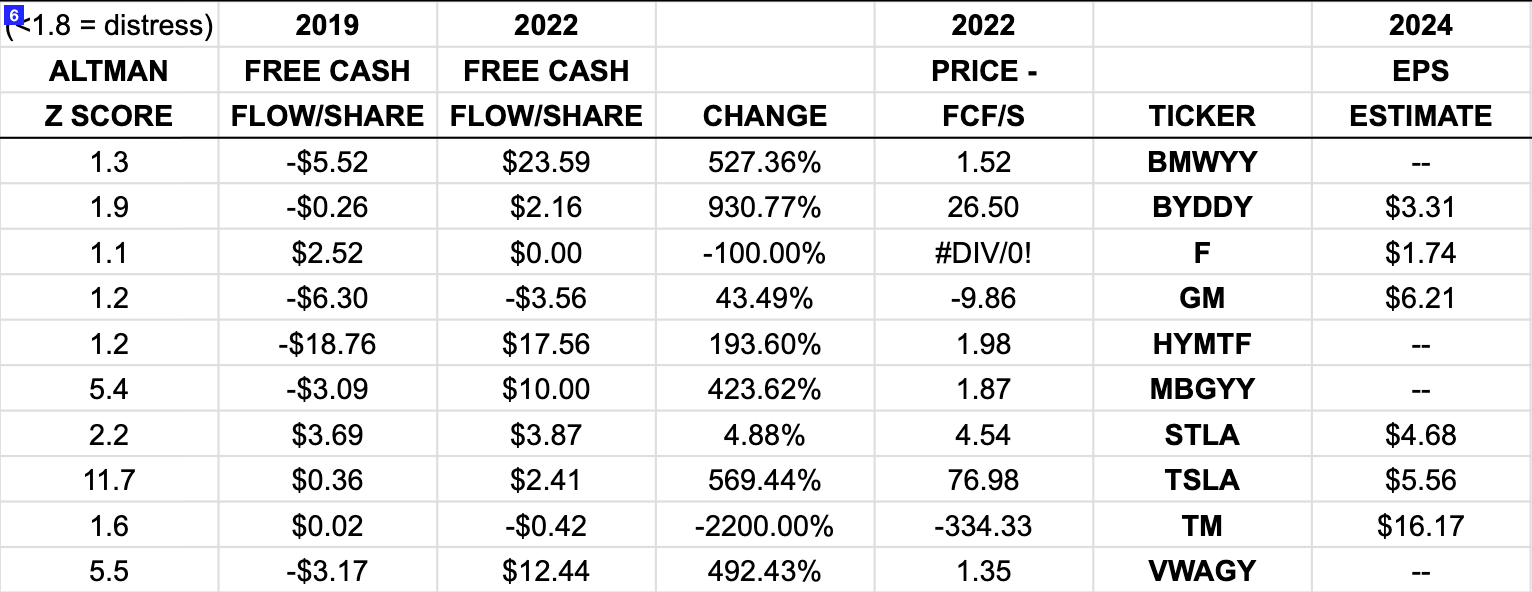
Image 7:
- Of the companies we do have 2024 analyst EPS estimates for, Ford’s -462% growth since 2022 stands out, as do Tesla at 66.16% and BYD at 99.4%.
- With the revenue estimates for 2024, the growth since 2022 of BYD at 80.03% and Tesla at 64.36% stand out. The other 8 companies average growth rate is expected to be 6.44% with Ford lagging at 1.09%.
- Now to find the Future Market Cap we take the revenue estimate and multiply it by a multiplier. The multiplier is the (PE(TTM) Ratio + PR Ratio) / 2 * (Revenue Growth Rate from from 2022-2024 / 2)
- If you have a better formula to use for the multiplier, please lettuce know.
- Ford stands out for having a negative Future Market Cap and Tesla being the only one in the $1T club.
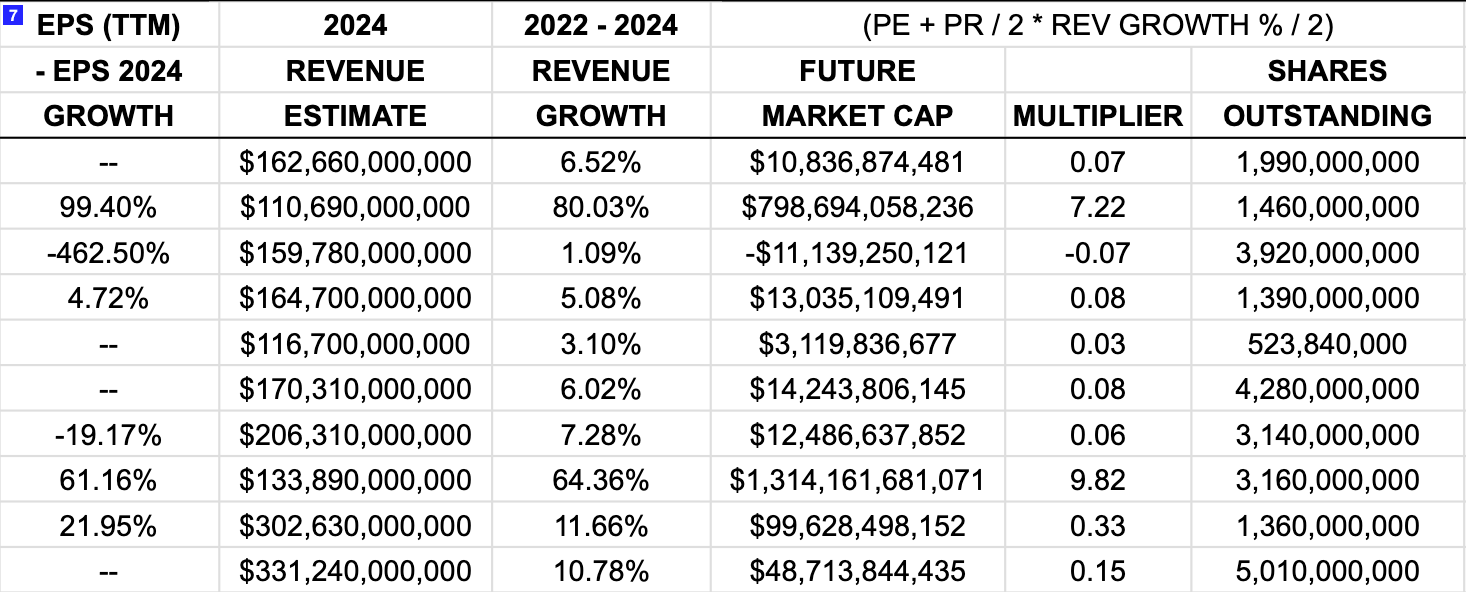
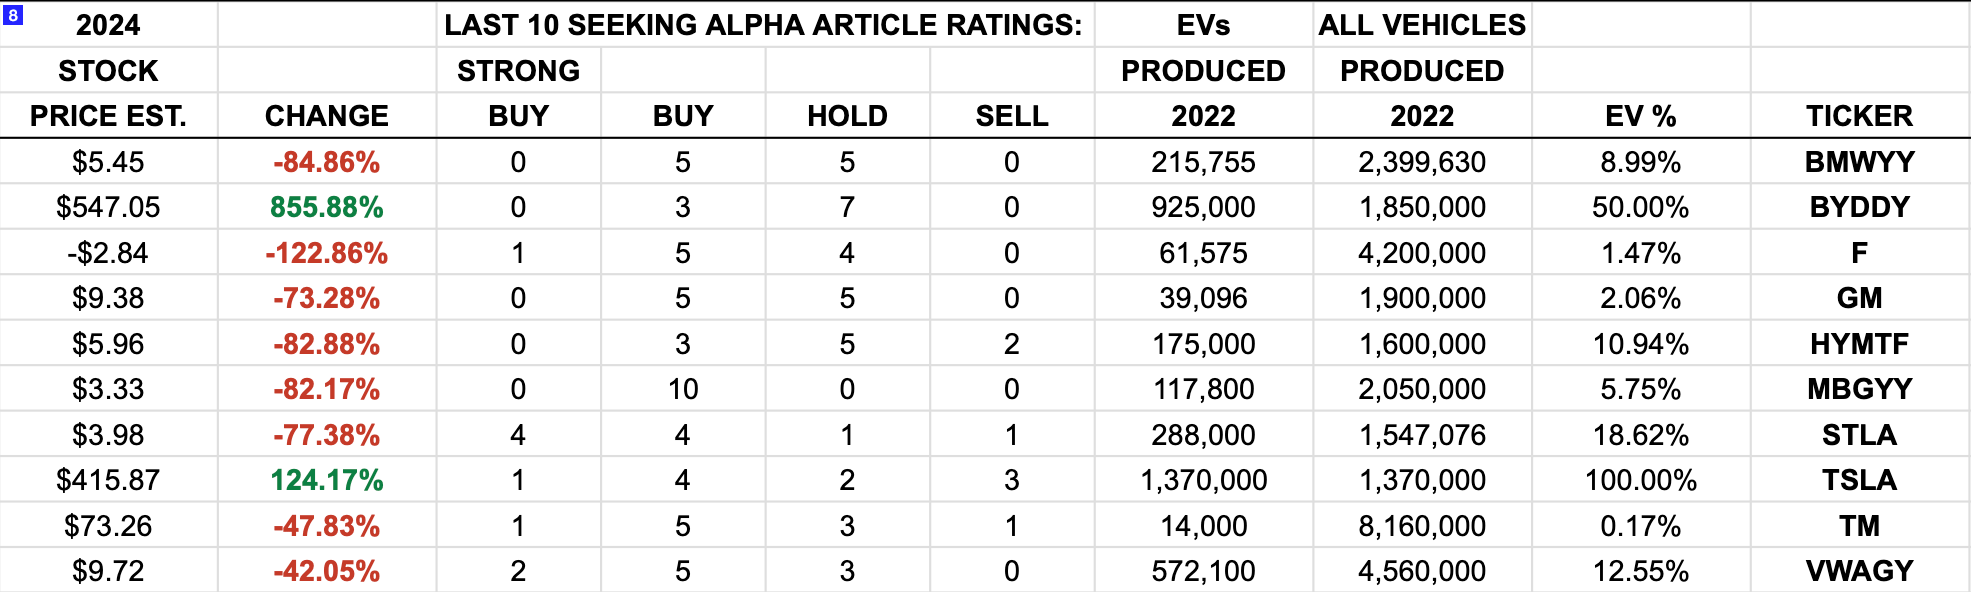
Image 8:
- The change in stock price from April 5, 2023 to the end of 2024 that this model predicts is staggering. BYD gets a blistering 855.88% growth. Tesla a healthy 124.17% growth and the rest are all negative with the average of all 8 companies being -76.73%.
- For some reason Seeking Alpha authors, at least according to the past 10 articles, have the most strong buy ratings for Stellantis (4), the most buy ratings for Mercedes (10) and the most sell ratings for Tesla (3). This model predicts Stellantis’s stock price to decrease by 77.38% by the end of 2024 and Mercedes to decrease by 82.17%.
- This model is quantitative only. It’s possible Mercedes and Stellantis have growth prospects that are not being factored into the analyst estimates that are being utilized in this model, but do your qualitative homework before investing in those companies.
- The last section shows the EVs and all vehicles produced by each company and gives an EV to non-EV ratio. Ford at 1.47%, GM at 2.06% and Toyota at 0.17% have a long way to go to transition their fleets ICE to EV. For the industry as a whole this transition is happening very quickly. We agree with @TonySeba and expect 90% or more new car sales to be EVs by 2030. That is a whole lot of legacy business to disrupt while simultaneously becoming innovators in the new transportation paradigm.
Conclusion:
- Tesla may look over valued based on past looking metrics, but on forward looking metrics, it is seriously under @#$%ing valued.
- So is BYD. Ridiculously so. But BYD has the China factor. But they are going to be a global auto manufacturer of significance in the near future.
- The other 8 auto OEMs in this study are the exact opposite of Tesla and BYD in terms of their forward looking metrics.
- Unless there are qualitative aspects to the companies not named Tesla or BYD, that will enable them to grow revenues, earnings and margins, they appear to be value traps … invest accordingly.
Sources: Financial data from Seeking Alpha with a little help from Yahoo Finance, production numbers from Google and Bing, image by BlueWillow.


